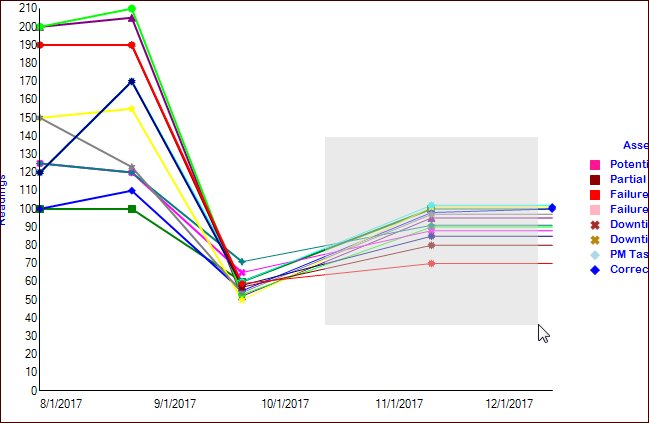
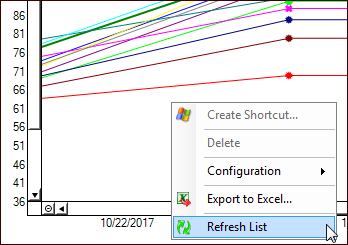
Concepts Tasks Settings Zooming In and Out on a Graph When viewing a comparative analysis graph that shows indicator readings over a period of time, you can “zoom in” to look at the readings in a portion of the graph. You can zoom out again at any time. To Zoom In To zoom in on a subset of readings, drag the mouse (click and hold down the primary button while moving the mouse) over the section of the graph that you are interested in. When you release the mouse button, the graph is redrawn so that it only contains the readings for the section that you selected. For example: To Zoom Out Right-click the graph and click Refresh List. For example: