|
|
What’s New in APM 7.12.4
Contents
APM and AssetWise 4D Analytics
APM incorporates functionality from AssetWise 4D Analytics to process large datasets, like the readings that come from Industrial Internet of Things devices: interconnected sensors, instruments, and other devices throughout the plant. 4D Analytics makes it possible to ingest and process large volumes of indicator readings in a small amount of time. Although the raw data is stored in a time series database (InfluxDB®), only readings that cross alarm state boundaries are sent to the APM database.Test Calculations with Live Data
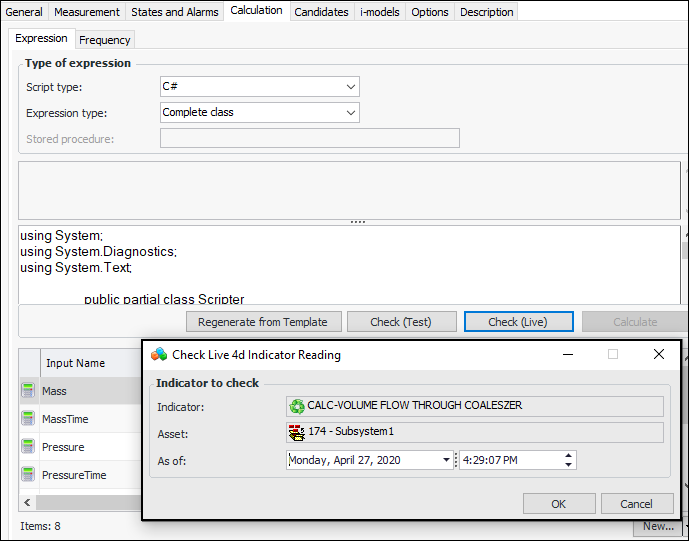
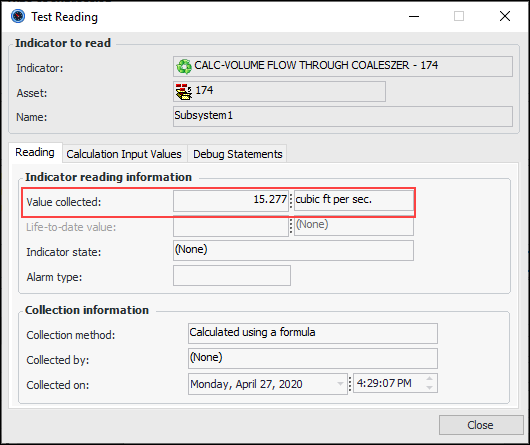
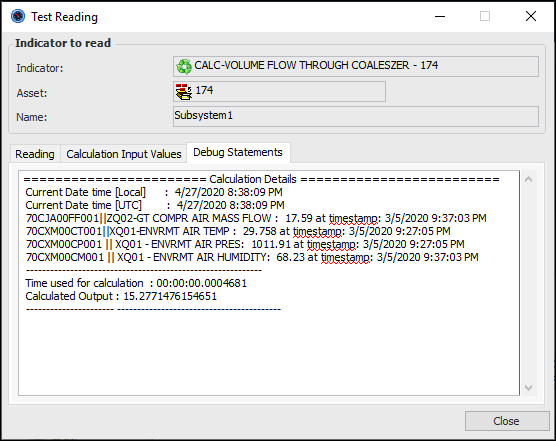
When developing 4D calculated indicators, you can test calculation inputs using readings retrieved from the Influx database. In the Indicator window, Calculation tab, click Check (Live). The Check Live 4D Indicator Reading dialog appears, showing the current date and time.Select the Calculation Input Values tab to see the input values.If the calculation formula specifies written output, the Debug Statements tab shows the result. For example:Create Influx Readings to Test Calculations
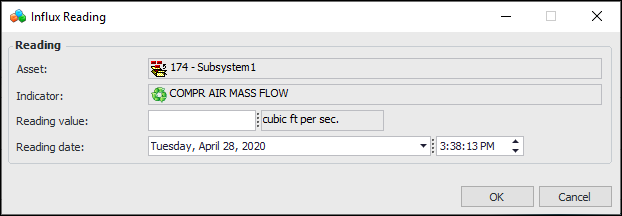
You can add readings to InfluxDB to test 4D calculated indicators using the Check (Live) feature. In the Indicator window of the calculated indicator, select the Calculation tab. For each input based on readings, open the indicator (double-click its icon in the input table).Logging Templates for 4D Indicators Calculations
Because of the volume of data generated by a 4D calculated indicator, it is not possible to display the calculation and inputs in the Indicator Reading window, Calculation tab. However, a wealth of information can be made available in the log files.
Table Configurations for 4D Indicators
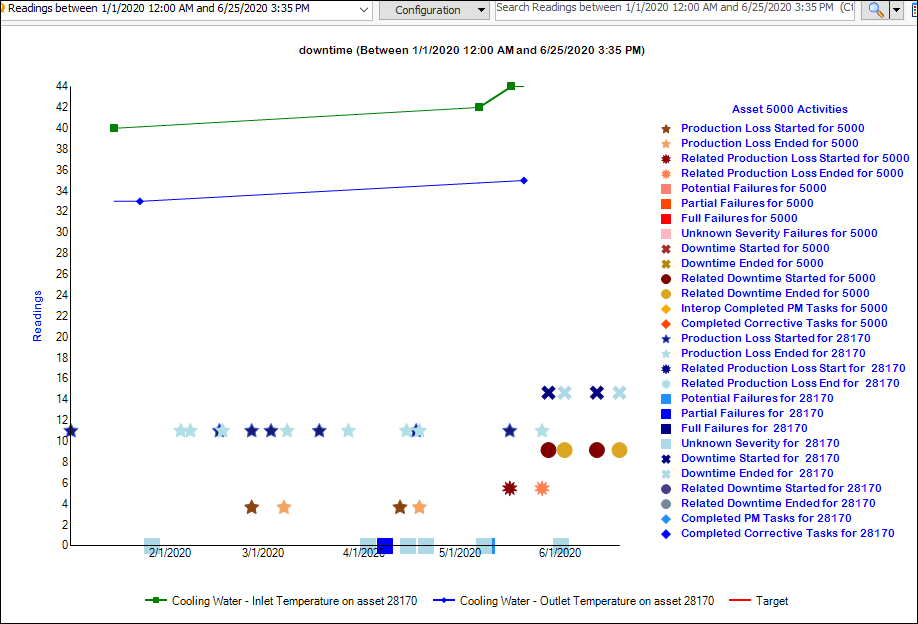
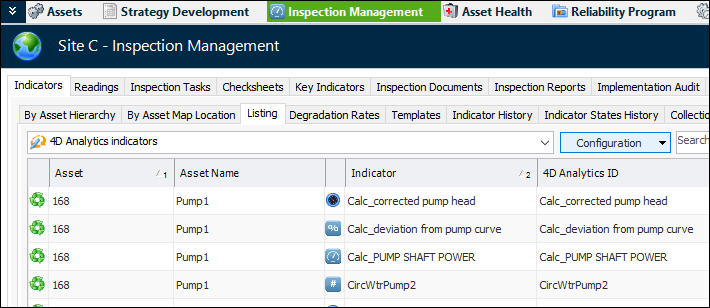
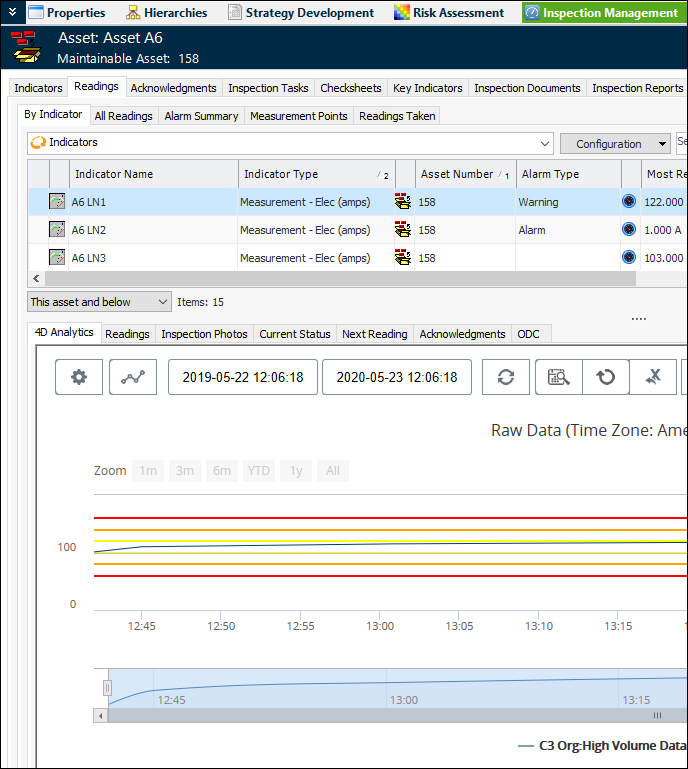
In the Site window, Inspection Management view, select the Indicators tab and the Listing tab. In the list of configurations, select “4D Analytics indicators”. The table lists the indicators by asset and includes the 4D Analytics IDs. For example:In the Asset window, Inspection Management view, select the Indicators tab. Both the Listing and By Asset tabs provide 4D Analytics indicators configurations.Select the Readings tab and then the By Indicator tab. Select a 4D indicator in the top table to view the 4D Analytics chart below:Browse for 4D Calculation Indicator Input
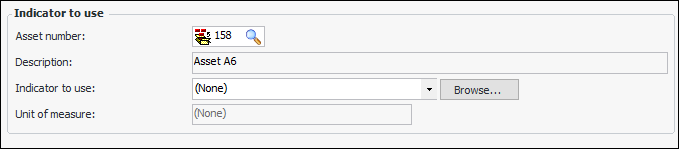
The Browse button is new for the Calculation Input dialog:
Alarm State Caching
Asset Prioritization Analysis – Probability Evaluation
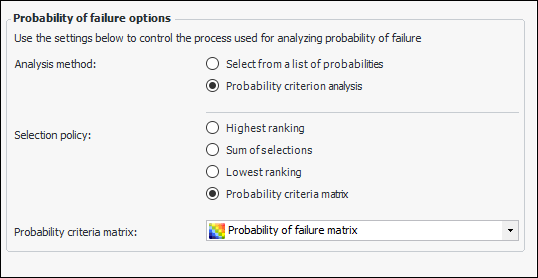
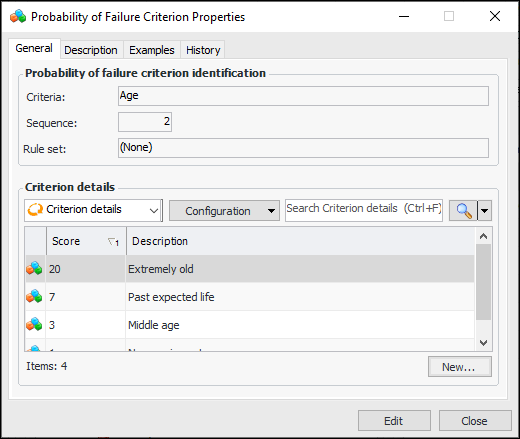
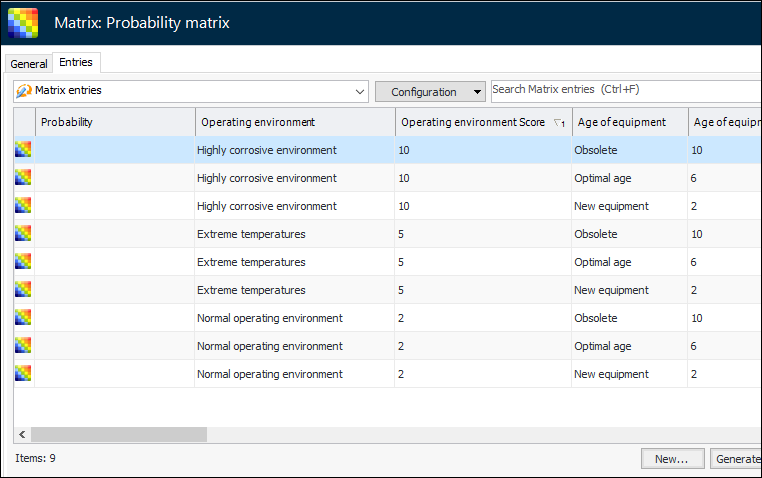
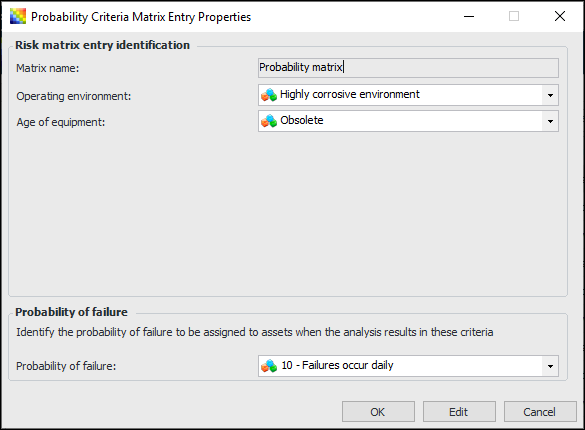
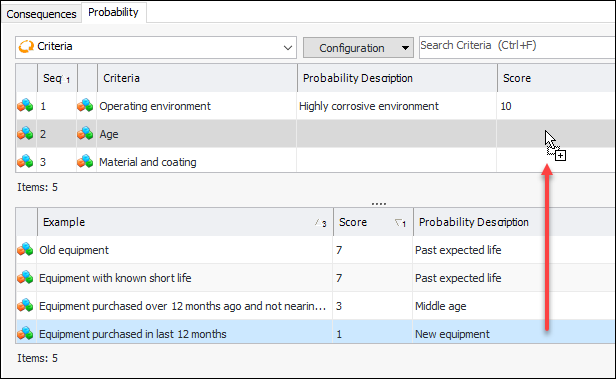
Note: To use this functionality in APM, you must first enable feature 39. In the Enterprise window, select the Customization Center view and the Enabled Features tab. Click Browse, select “Criteria based probability evaluation on an asset prioritization analysis”, and click OK. If APM is running as a smart client, click Refresh Enabled Features on the server. Then restart the client to use the functionality.The probability analysis is designed to complement the consequence evaluation in prioritization analyses. On the Probability tab, select a criterion in the top table to display examples in the table below. Drag and drop the appropriate example to the criterion’s line to enter its score. For example:When you have completed the probability and consequence evaluations and click Calculate Scores, APM assigns the probability of failure and consequence priority to the analysis. The probability score is used in the calculation that determines relative risk.Setting up APM for Probability Analysis
AWEIS – Interop Work Documents
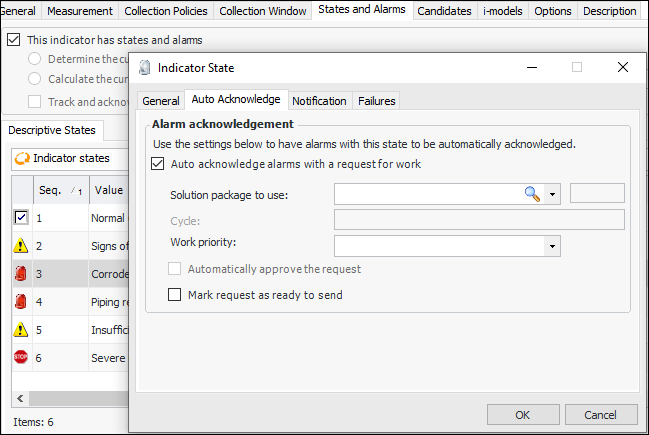
Automatic Acknowledgment with Request for Work
Secondary Statuses
In the Request for Work dialog, the Statuses tab now displays secondary statuses and groups as a simple list with check boxes for selecting statuses.Solution Packages – Support for Events, Tasks, Labor
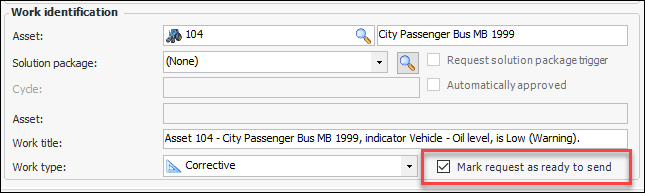
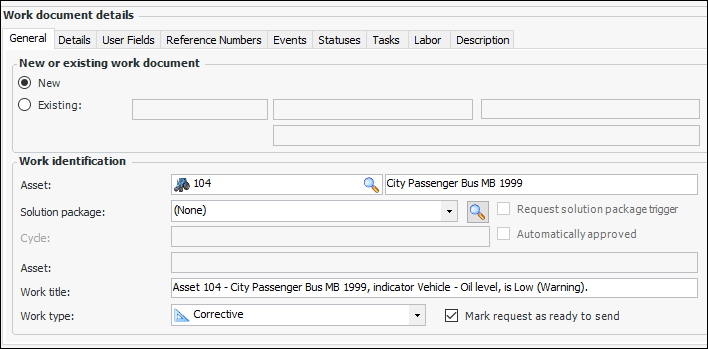
Requests for Work – Mark as Ready to Send
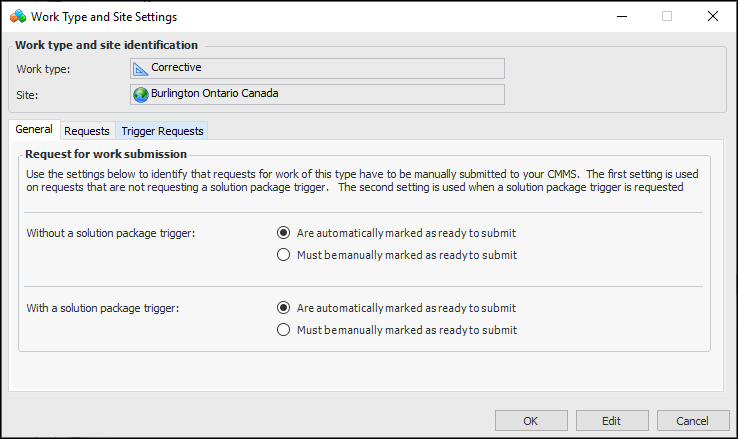
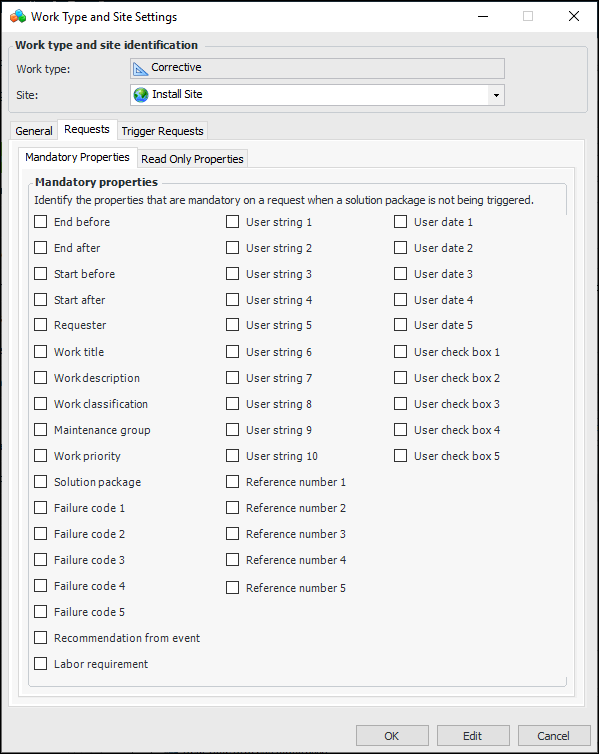
If Mark request as ready to send is not selected, the request must be submitted manually.The default value of Mark request as ready to send is controlled by the work type’s site settings. In the Work Type and Site Settings dialog, the General tab now provides options for two scenarios: when a solution package is selected for the request and when a solution package has not been selected. For both scenarios, the choice is between automatically and manually marking the request as ready to send.Requests for Work – Control Event Creation
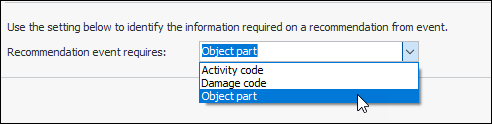
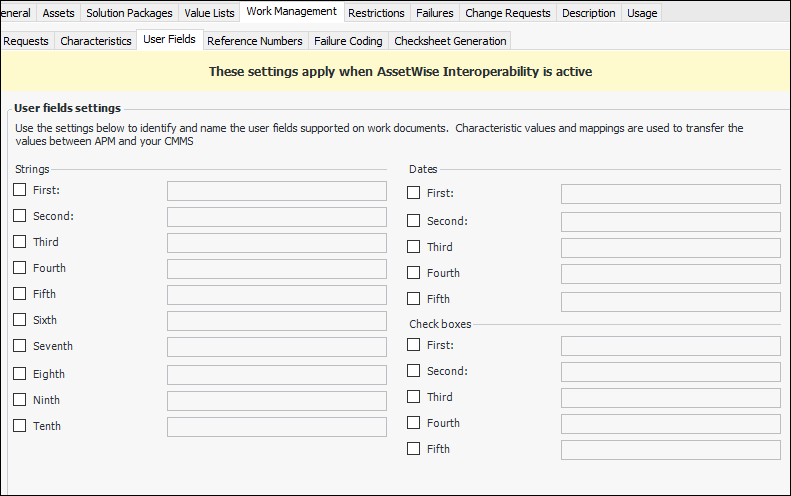
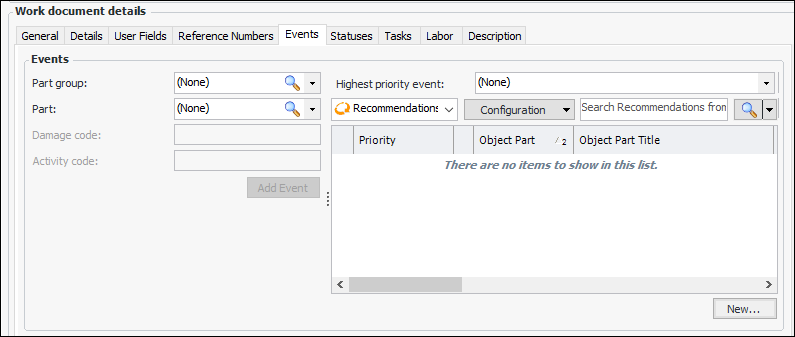
When you are adding an event to a request for work, the information you must supply in order to save the event is controlled by settings in the Site Interoperability Profile. The Recommendation event requires option specifies whether only the object part is required, damage code and object part are required, or activity code, damage code, and object part are required.In the Site Interoperability Profile Properties dialog, select the Work Management tab and the Failure Coding tab.AWEIS – Defining Properties on Interop Work Documents
AWEIS – Checksheet Generation Date
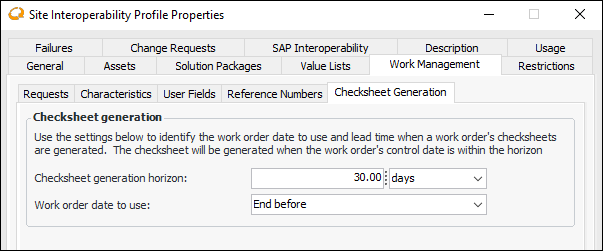
In the Site Interoperability Profile dialog, you can more precisely define when checksheets will be generated for interop work orders. Checksheets will be generated when the work order’s control date (for example, Start before) is within the generation horizon. Select the Work Management and Checksheet Generation tabs:AWEIS – Interoperability Data Readiness
Filters for APM-Only Assets
Changing the Status of Requests
Requests have the status “Draft” when they are created. They must be marked as “Ready to Process” before they can be processed. You can control the request’s status in the Interoperability Data Readiness Request dialog using the Mark as Ready to Process button.Now you can change requests’ status in the Profiles tab, which lists all of the requests. Select one or more requests in the table, click the Selected list, Mark As, and then either Ready to Process or Draft.AWEIS – Marking an Object as Interoperability Inactive
To mark an object as inactive, select it in a table, right-click, and click Mark AssetWise Interoperability Inactive.Data Loading
Maintenance Action Plan Indicators
Maintenance Action Plan Critical Spares
RBI FMEA – Additional Information
Indicators – Additional Information
Indicator Templates
Standard Tasks – Additional Information
Failures
Production Loss Events – Additional Information
Work Order Tasks – Additional Information
Inspection Management
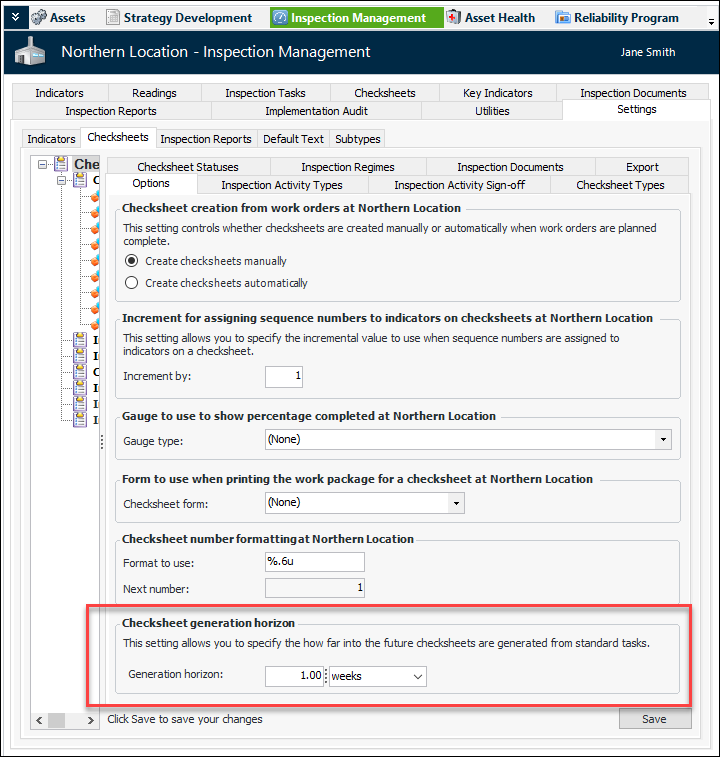
Automatic Checksheet Generation from Standard Tasks
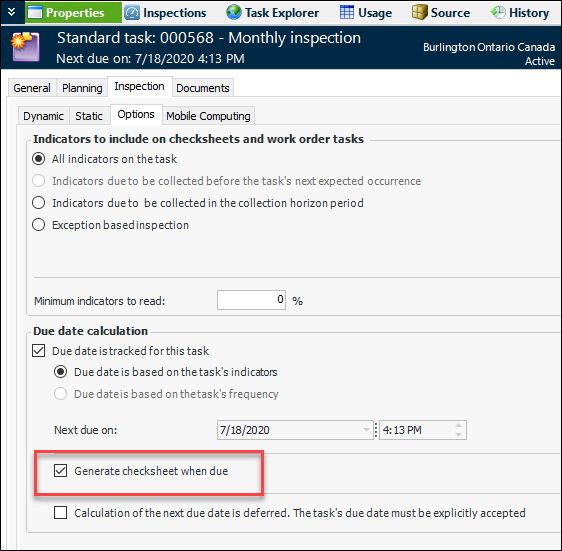
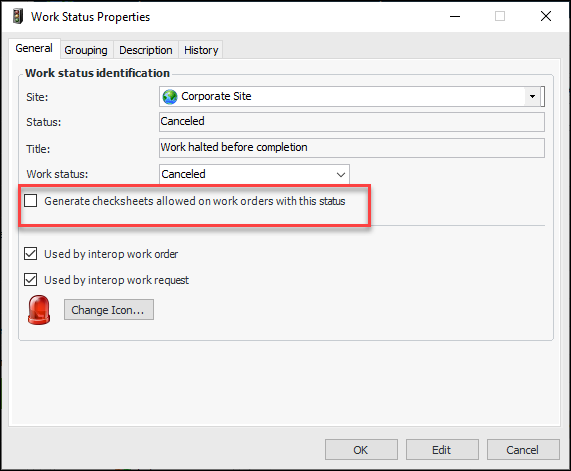
Note: This functionality is available as a Technology Preview. To use it in APM, enable feature 51. In the Enterprise window, select the Customization Center view and the Enabled Features tab. Click Browse, select “Support generation of checksheets for standard tasks, without requiring a work order”, and click OK. If APM is running as a smart client, click Refresh Enabled Features on the server. Then restart the client to use the functionality.In APM the functionality is enabled in the standard task’s due-date tracking settings. You can select Generate checksheet when due. For example:The checksheet generation horizon for standard tasks is set to one week by default. You can change it by selecting the Inspection Management view, Settings tab, Checksheets tab, and Options tab:Work Order Status Controls Checksheet Generation
Indicator Instructions
In Indicator and Indicator Reading dialogs, the Instructions tab now supports rich text only.Acknowledge Indicator Alarms with AWEIS
The Acknowledge Indicator Alarm dialog has changed to be consistent with the dialog on APM Remote. The solution package options appear on the Acknowledgment tab, General tab. For example:A separate Events tab allows you to add events:Production Loss Accounting, Advanced Version
Asset Products Tab on Site
The Production view on the Site window now provides the Asset Products tab that lists all of the products for the site. You can use the filters at the bottom of the tab to view products for sites below and above the current site.On the Asset Products tab, you can create products without having to open Asset windows. You can also copy products to other assets on the same site or other sites that support advanced production loss accounting. And you can use the Replace Column Data feature to change values in all of the listed products.Downtime and Production Tab on Asset
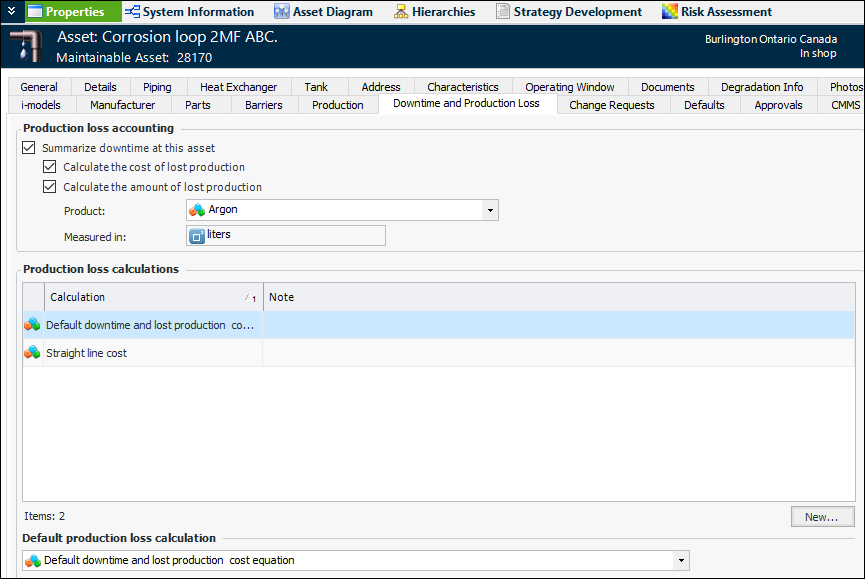
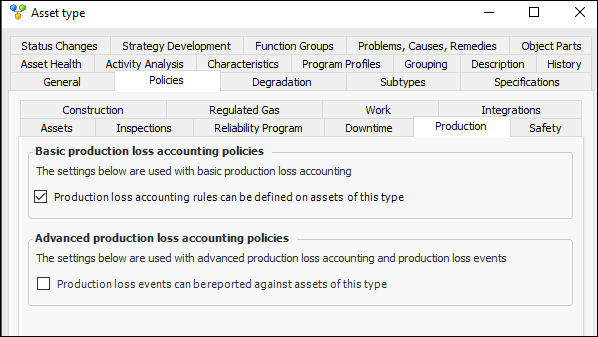
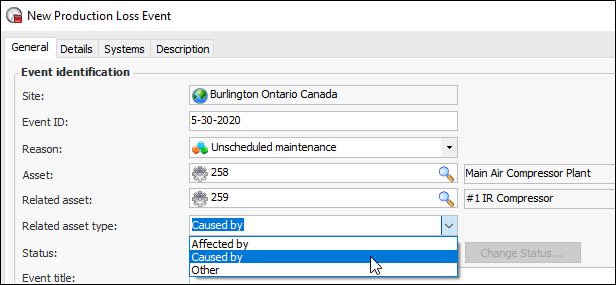
In the Asset window, the Downtime and Production Loss tab is used to summarize downtime for the asset, calculate the amount and cost of lost production, and add production loss calculations to the asset and product. For example:This tab’s availability is controlled by the asset type. In the Asset Type window, Policies tab, the Performance tab has been replaced by separate Downtime and Production tabs.The Production tab allows you enable production loss accounting rules for basic production loss accounting. When the option is selected, the Downtime and Production Loss tab is available for assets of that type.When Production loss events can be reported against assets of this type is selected, the Production tab is available for assets, showing products, calculations, and cost intervals.Related Asset on Production Loss Events and Downtime Incidents
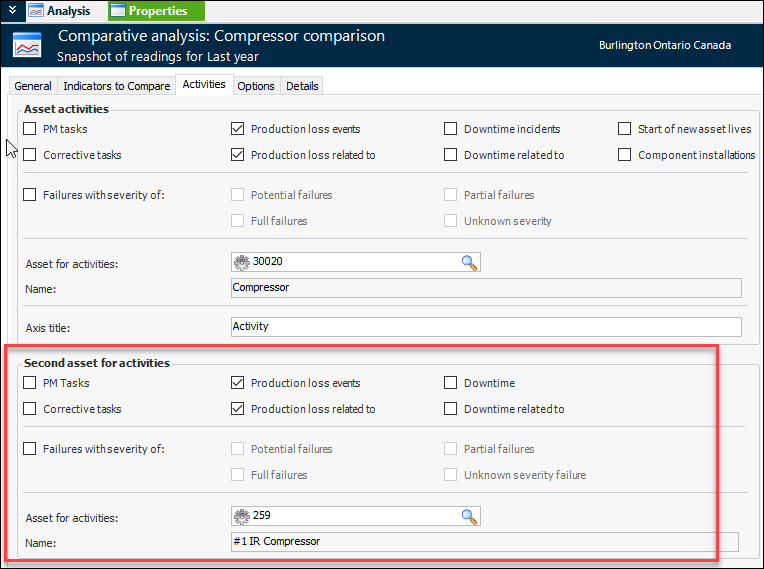
Comparative Analysis
Regulated Gas Management – Equipment Decommissioned
When creating a gas transaction that requires a value for Equipment decommissioned, you will notice that the default value is now null, rather than “Yes”. This means that you are required to select a value (yes, no) in order to save the transaction. This change prevents incorrect reporting of decommissioning events.Reliability Program – Apply Template to Multiple Tasks
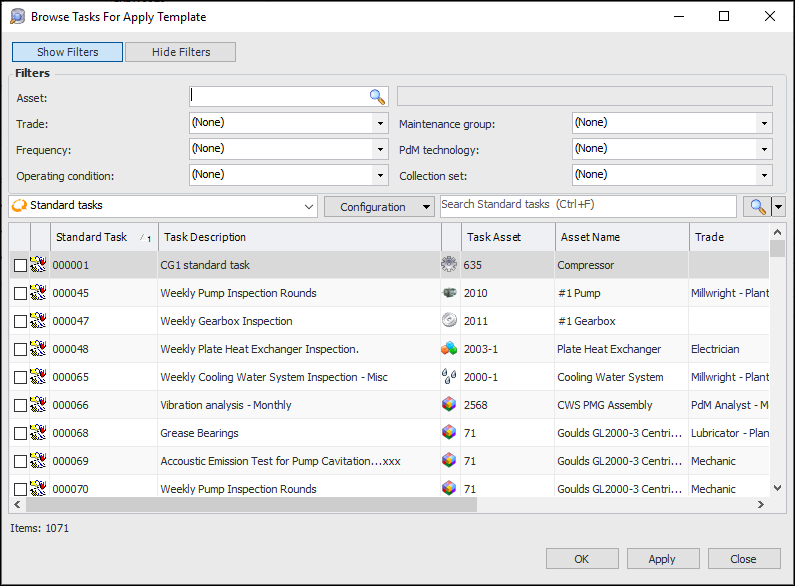
You can now apply a task template to two or more standard tasks at the same time. In the Standard Task window for the template, click the Tools menu and then Apply to Standard Tasks. The browse dialog that appears displays the standard tasks from the template’s site and below. Only tasks that do not use the template are displayed.You can use the filters to refine the list of standard tasks. When you select the tasks and click OK, the tasks are updated with information from the template. The template replaces any templates that already exist on the tasks.RFQs – Excel® Files Emailed to Suppliers
Strategy Development Analysis
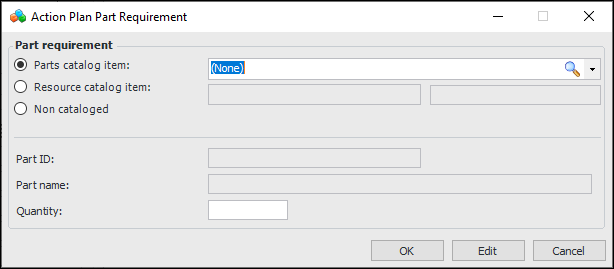
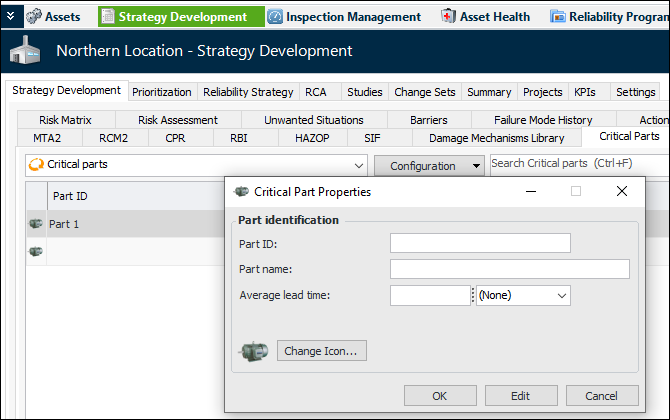
Critical Parts on Action Plans
In the Maintenance Action Plan window, Implementation view, select the Critical Parts tab and click New. The Action Plan Part Requirement dialog appears:In the Strategy Development Analysis window, you can select the Analysis Summary view, Critical Parts tab to see a list of the parts for all of the action plans in the analysis.You can maintain a parts catalog in the Site window, Strategy Development view and tab, Critical Parts tab. For example:Note: To use this functionality in APM, you must enable feature 42. In the Enterprise window, select the Customization Center view and the Enabled Features tab. Click Browse, select “Support for critical parts identification on a maintenance action plan”, and click OK. If APM is running as a smart client, click Refresh Enabled Features on the server. Then restart the client to use the functionality.Table Configurations
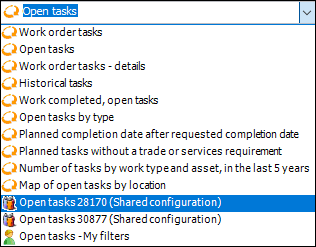
Shared Personal Configurations
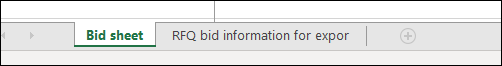
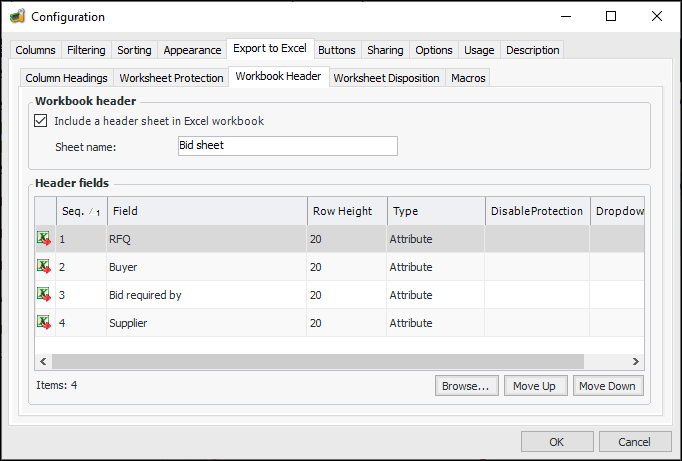
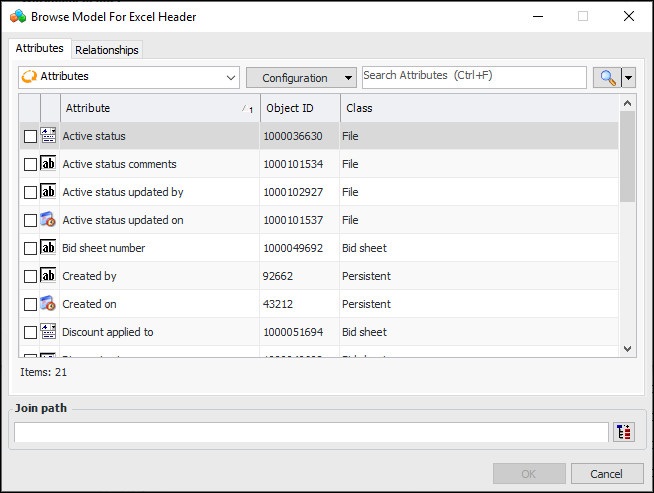
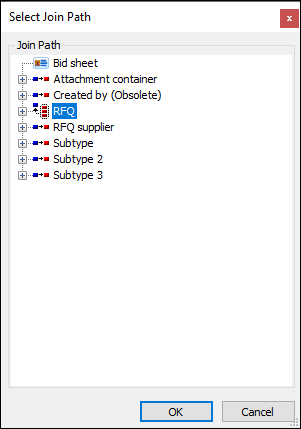
Export to Excel Workbook Header
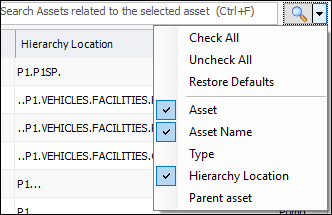
Quick Search Bar – List Contents
 ‘
‘