|
|
What’s New in APM 25.0.2
Contents
Assets
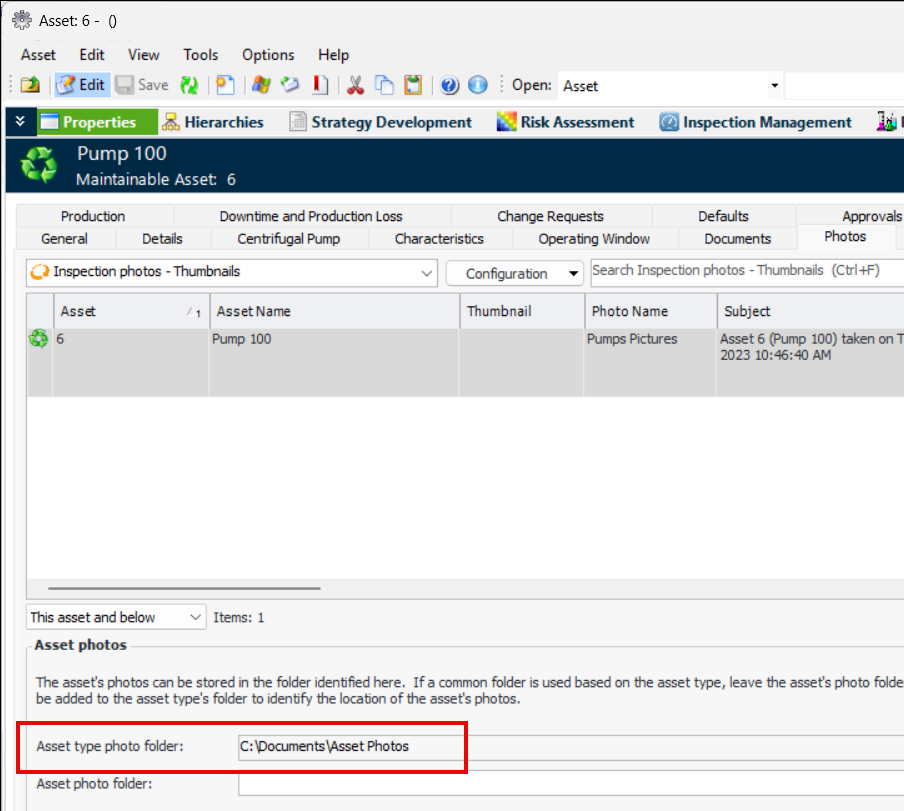
Photo Folder for Asset Types
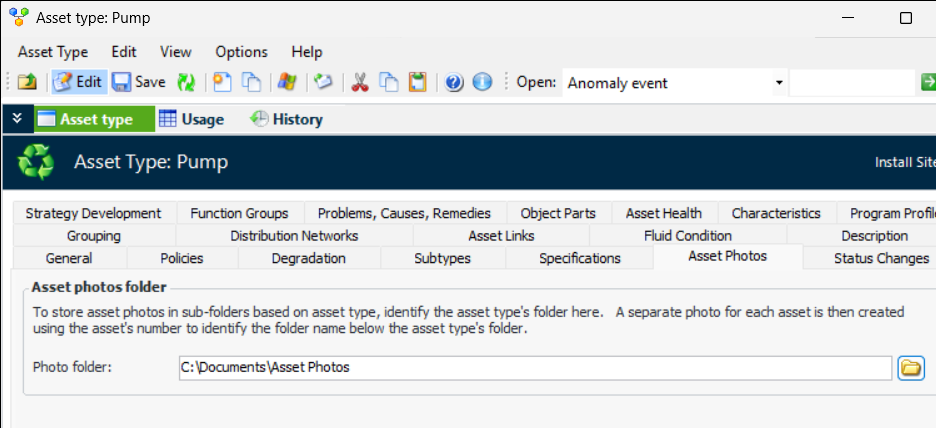
Photo folders can now be maintained at the level of asset types, with photos identified for their individual assets. For example, when adding or updating an asset type, select the Asset Photos tab and add a folder:If you leave the Asset photo folder blank, the asset number will be added to the asset type’s folder to identify the location of the asset’s photos.When you save a photo, you have the option of saving it to the asset type or the asset photo folder.Asset Types – Settings Review
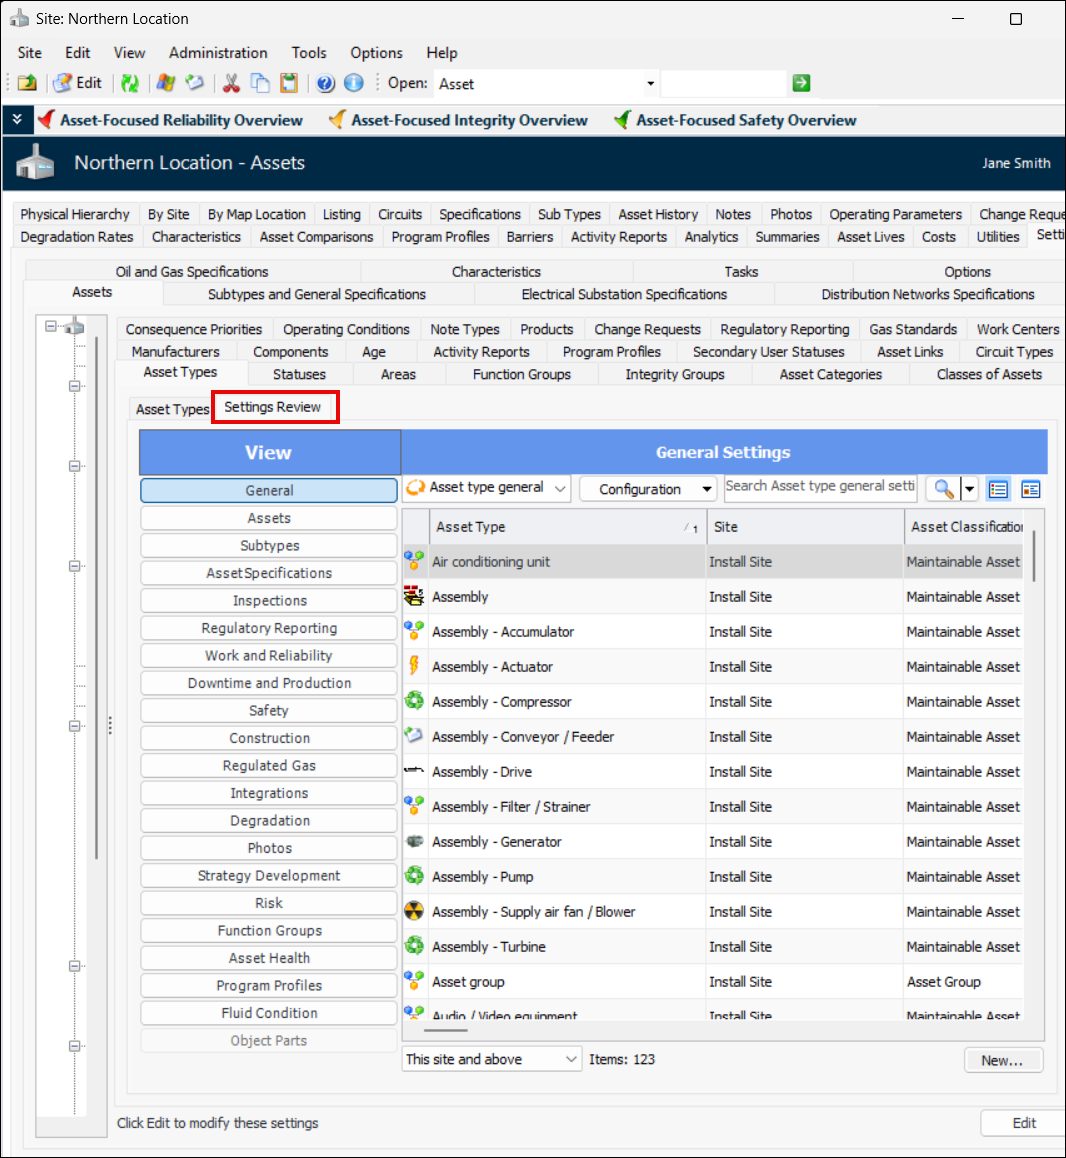
The new Settings Review tab makes it easier to review all of the asset types on one or more sites in one table. You can compare and update properties, ensuring that asset types are current with new functionality and consistent with each other.In the Site window, select the Assets view, Settings tab, Asset Types tabs, and Settings Review tab:Select a section on the View column to see information by topic:
AWEIS – Asset Change Requests
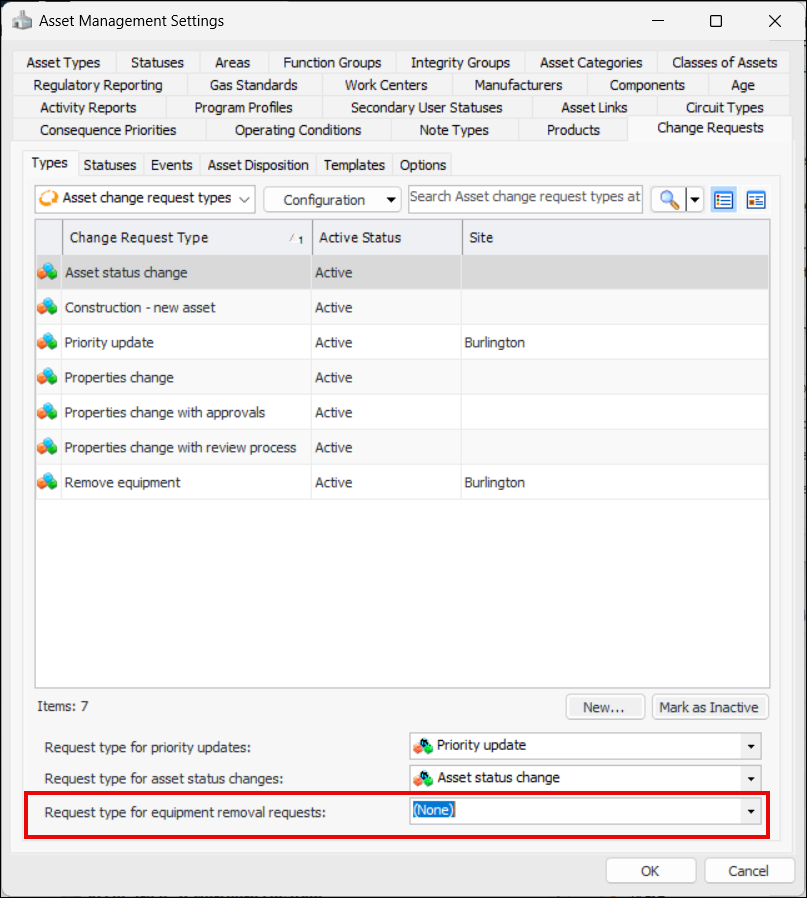
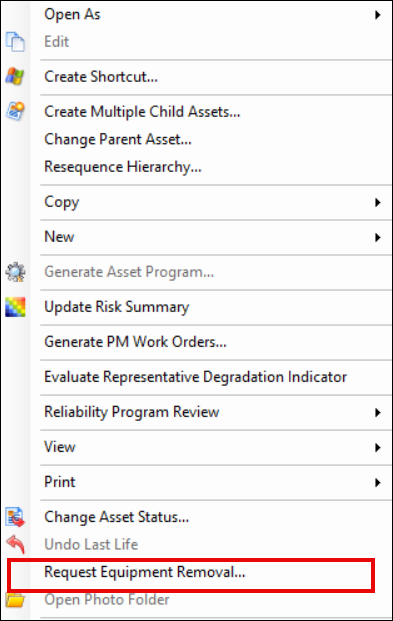
At the site level, you can now set the default type of asset change request to be used for equipment removal requests. In the Asset Management Settings window, select the Change Requests tab, Types tab.As long as the asset type supports remove equipment requests, you can right-click an asset in a list to select Request Equipment Removal:AWEIS – Failures from Breakdown Codes
AWEIS – Request for Work Link to Failure
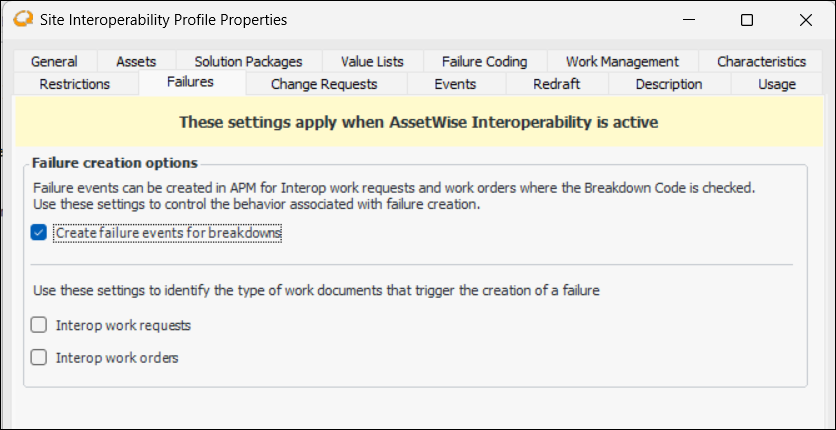
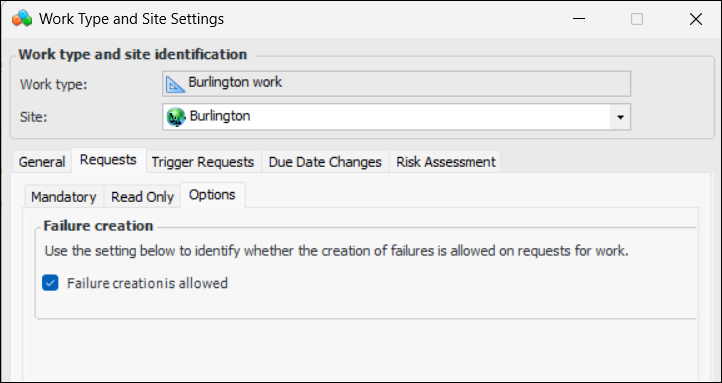
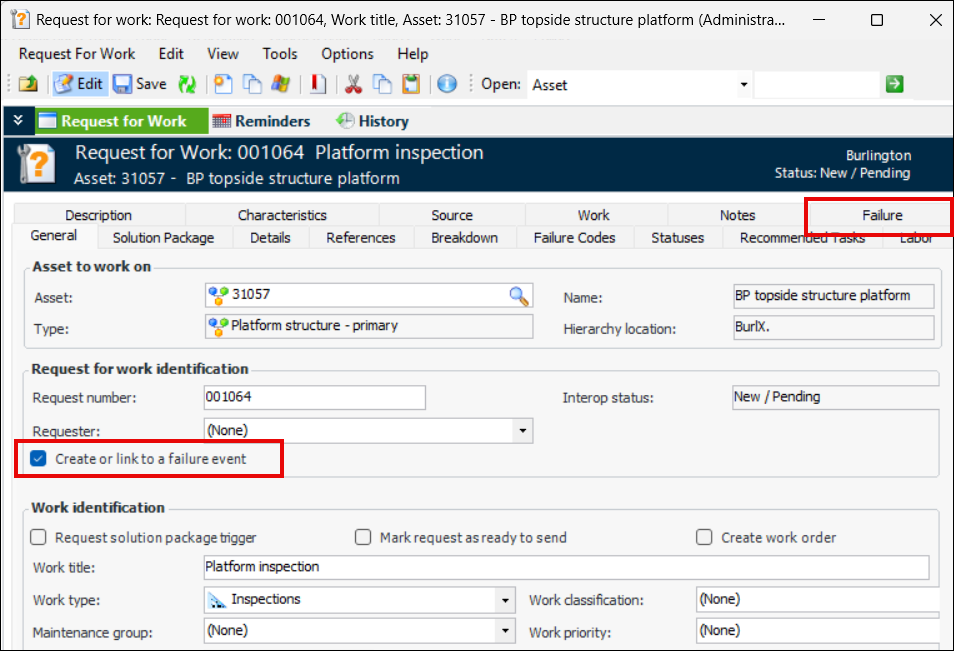
On the request for work, you can click Create or link to a failure event, just as you can on an indicator alarm acknowledgment. The Failure tab appears:Note: Creating failures from a request for work is generally available functionality. However, you must first enable feature 143 to use the functionality in APM. In the Enterprise window, select the Features view and the Enabled Features tab. Click Browse, select “Create Failure from a Request for Work” and click OK. If APM is running as a smart client, click Refresh Enabled Features on the server. Then restart the client to use the functionality.AWEIS – Filtering Work Documents for Linking
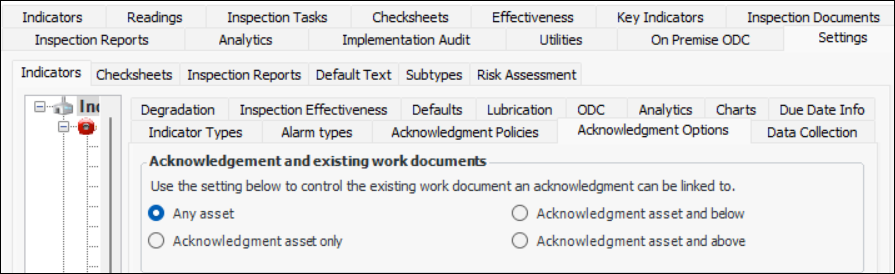
Browse dialogs now filter existing interop work documents according to site-level options when you wish to link documents to indicator alarm acknowledgments. To set the options, select the Site window, Inspection Management view, Settings tab, Indicators tab, Acknowledgment Options tab. At the bottom of the tab, click Edit to open the site to updates.
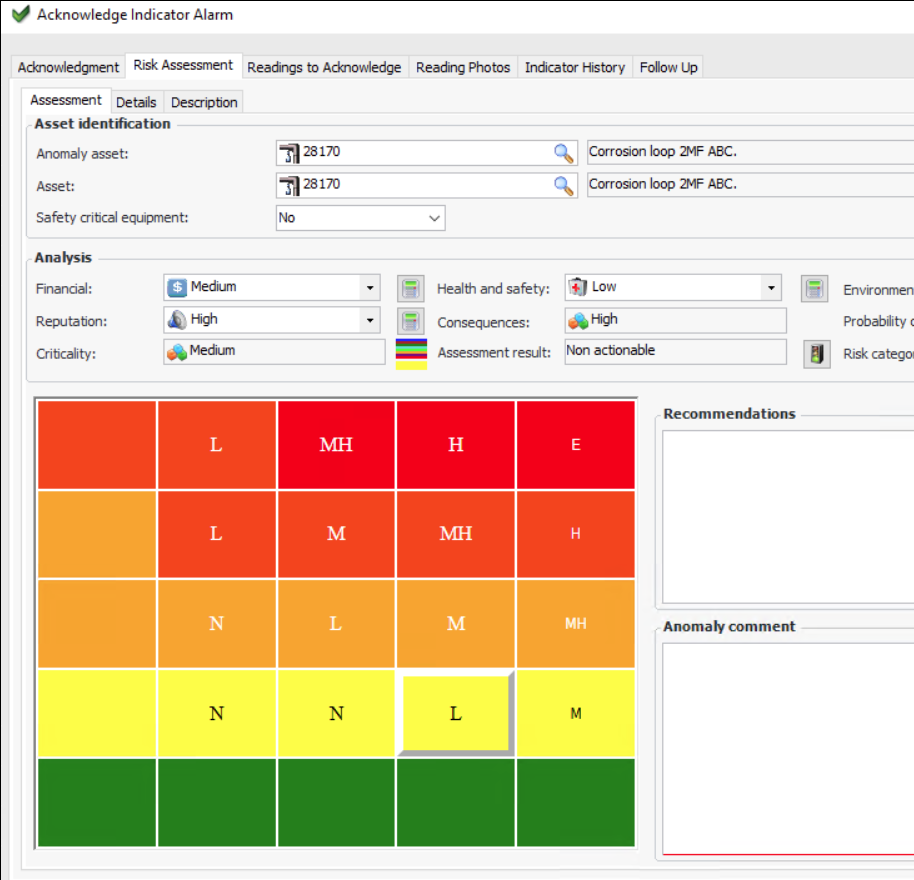
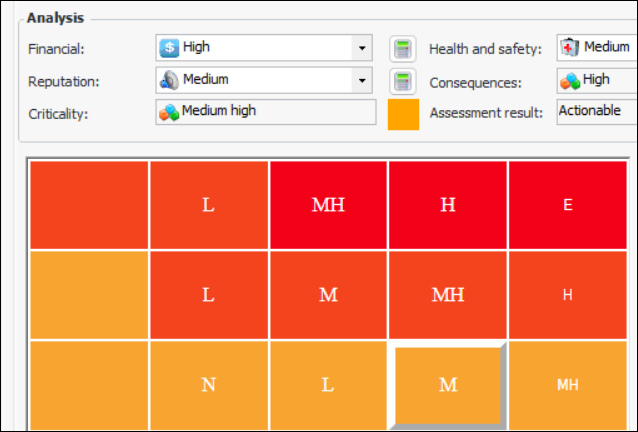
AWEIS – Anomaly Risk Assessment
Links Between Anomaly and Failure Events
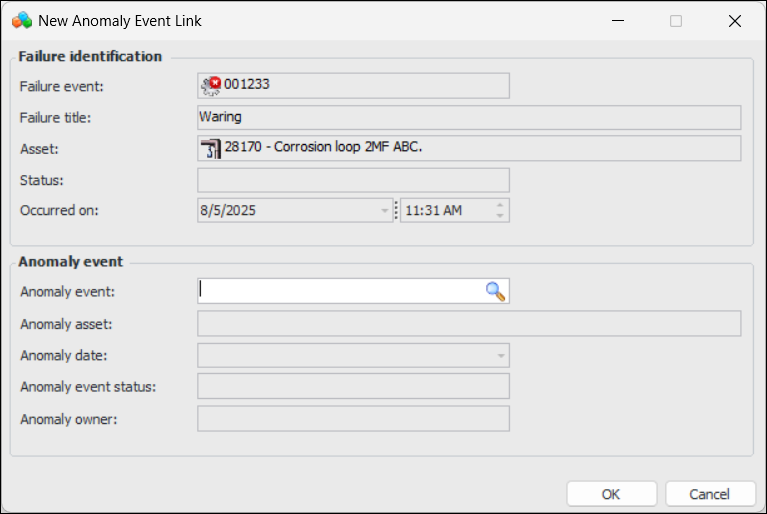
Links between anomaly and failure events are normally created in the alarm acknowledgment process. It is now possible to manually create links between failures and anomaly events. For example, open the failure, select the Anomaly Events view and tab, and click New Link to open the New Anomaly Event Link dialog:Risk Matrix on Risk Assessment
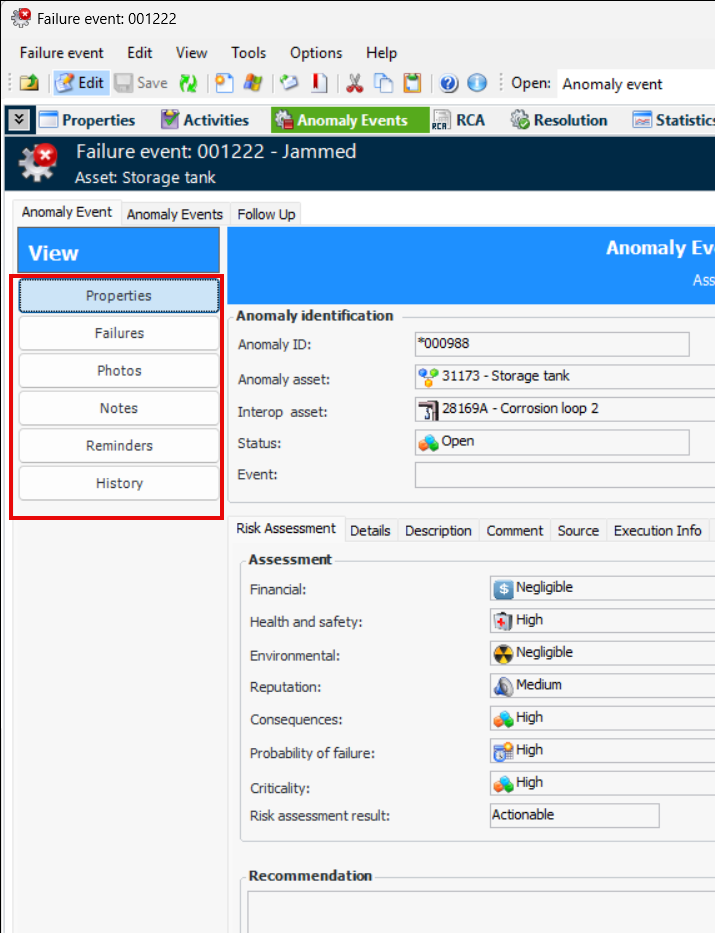
View Anomaly Event Tab in Failure Event Window
The Failure Event window, Anomaly Events view now displays the Anomaly Event tab, which displays various information about the anomaly event:Associate a Color with a Criticality
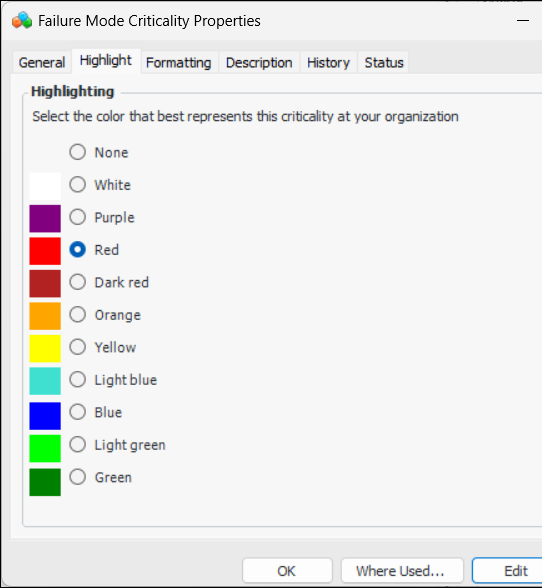
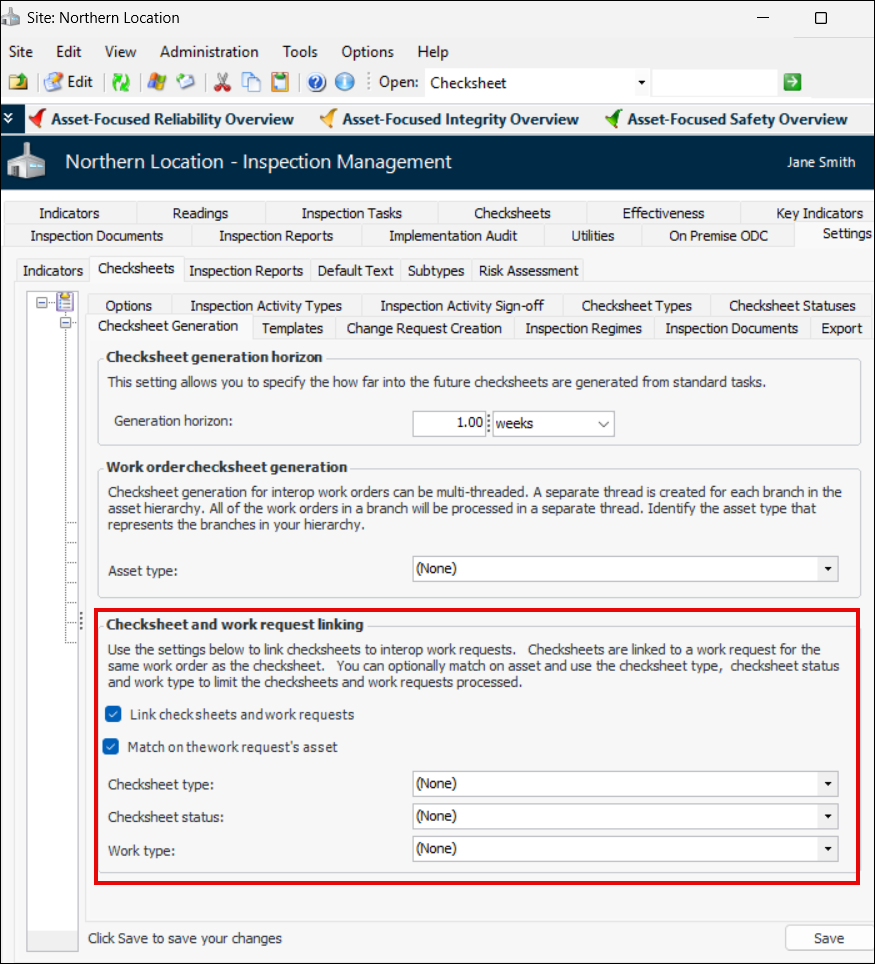
When setting up risk criticalities for your organization, you can now associate a color with each criticality value. In the Site window, select the Strategy Development view, Settings tab, Risk tab, Criticalities tab. Double-click a criticality in the list to open the Failure Mode Criticality Properties dialog. Click Edit to open the dialog for updating. Select the Highlight tab:The color is displayed to the right of the Criticality value where it is displayed with the risk assessment, for example, in the alarm acknowledgment and the anomaly event. For example:AWEIS – Checksheet and Work Request Linking
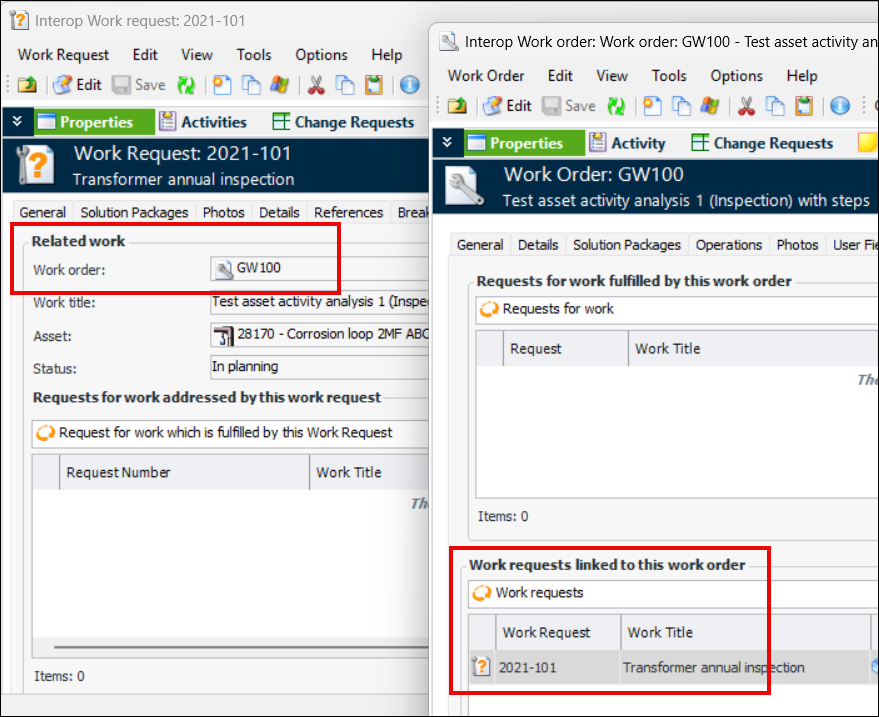
These settings are on the Site window, Inspection Management view, Settings tab, Checksheets tab, Checksheet Generation tab. Click Edit at the bottom of the tab.AWEIS – Interop Work Request Reference on Work Order
Charts – Format Style
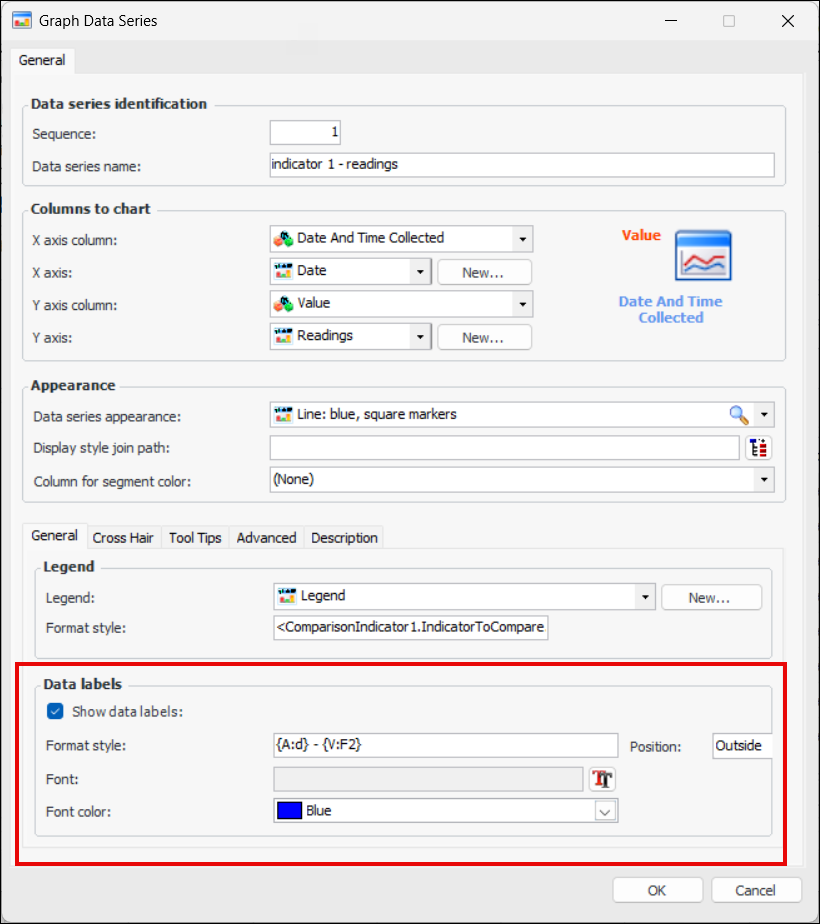
APM now uses DevExpress®.NET WinForms chart and gauge controls. This means that when defining legends, data labels, cross hairs, axes, and tool tips on charts you must use DevExpress text patterns. The Format Style text box is available so that you can enter text pattern strings. The following sections provide examples from graph data series.Graph Data Series – Data Labels
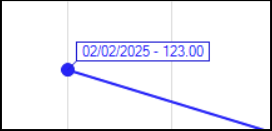
In this example, the Format style box contains the text pattern for the labels:
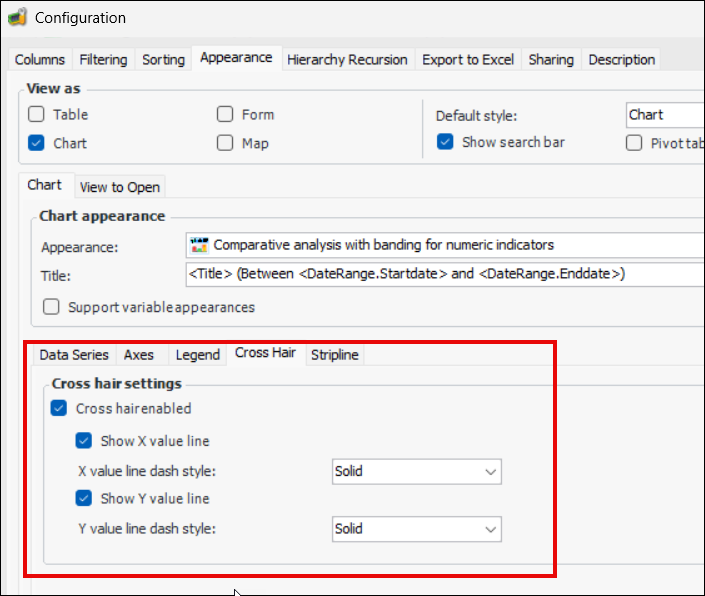
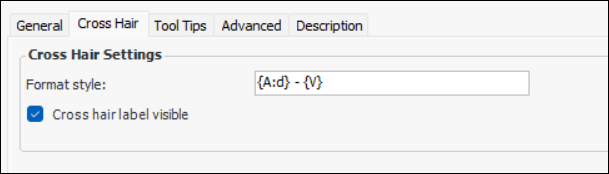
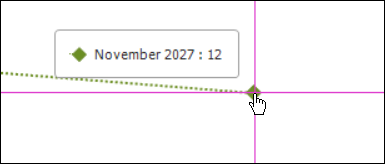
Graph Data Series – Cross Hair
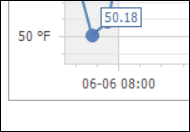
you can refine its use on individual data series. On the Cross Hair tab, control whether or not the cross hair label is visible and use the Format style text pattern to define the content of the label. For example:Graph Data Series – Tool Tips
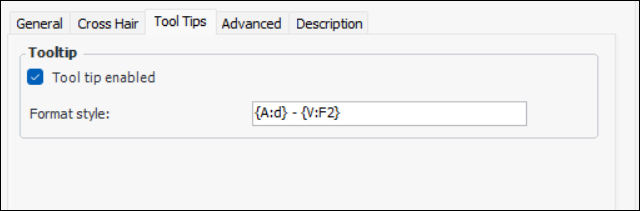
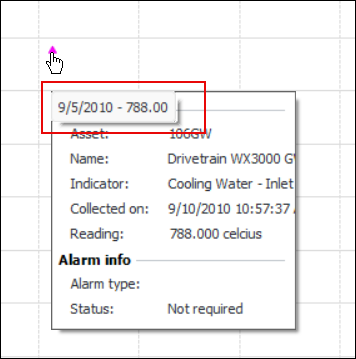
Tool tips continue to be supported on graph data series, although not for legends. You can now use the Format style text box to enter a DevExpress text pattern to define the content and formatting for the tool tip.Tool tips are defined in the data series on the Tool Tips tab. For example:Axes
Here is an example of x and y axes that use the Format Style text box. The x axis format style is:Charts – Pareto Lines
Data Loading – Indicators and Templates
Find Bar Sets
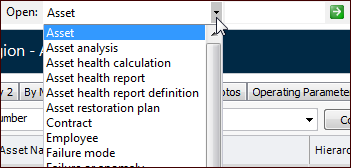
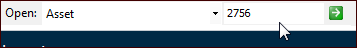
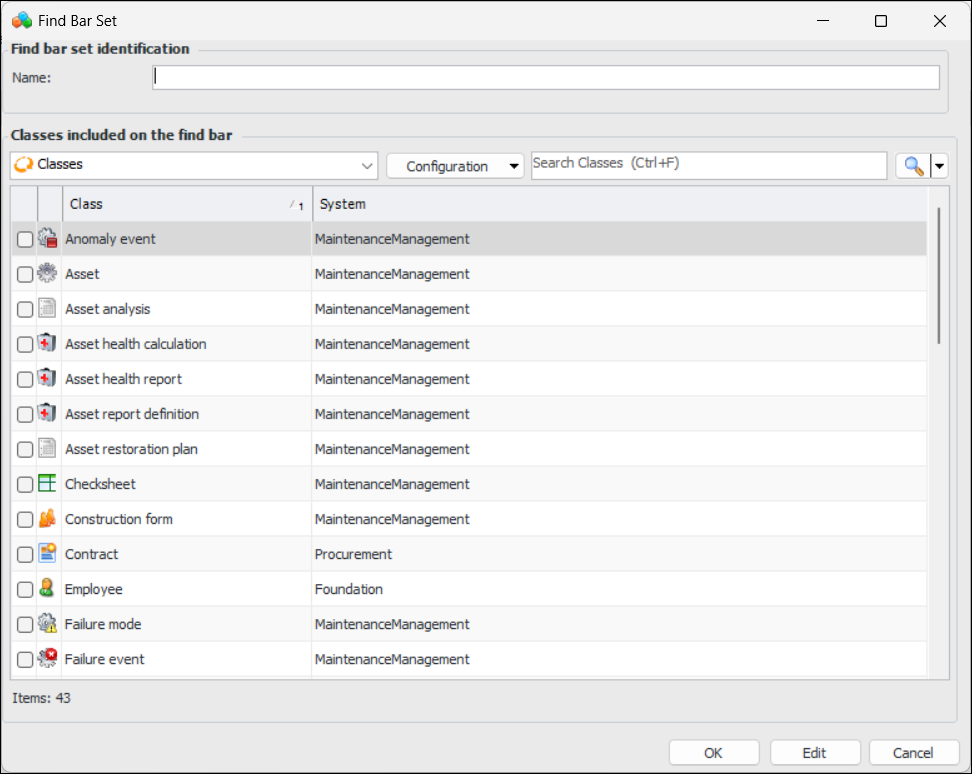
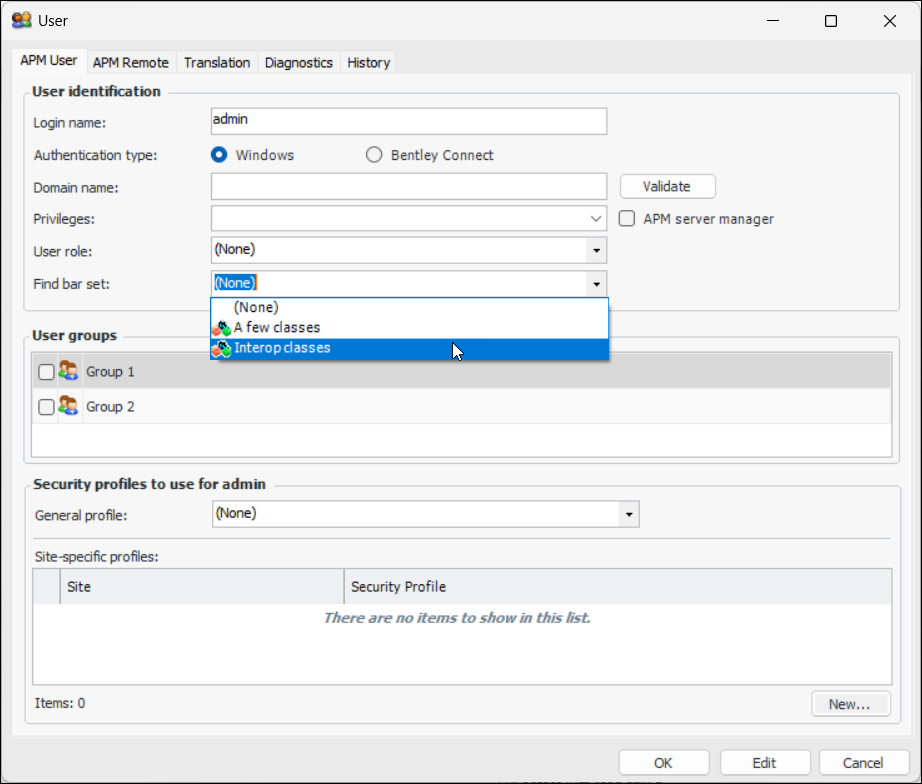
Find bar sets are created in the Enterprise window, Customization Center view, User Interface tab, Find Bar tab. Click New to open the Find Bar Set dialog:At the bottom of the Find Bar tab, you can click Change to set the default find bar set for the enterprise.To assign a find bar set to a user, select the Security view, Users tab, and double-click the user to open the User dialog. Click Edit to open the dialog for editing. In the Find bar set list, select the appropriate set:Click OK. The user will now have access only to those classes in the find bar.Inspection Management
Copying Variable Measurement Points
Alarm Acknowledgment Policy can be Based on Indicator rather than Site
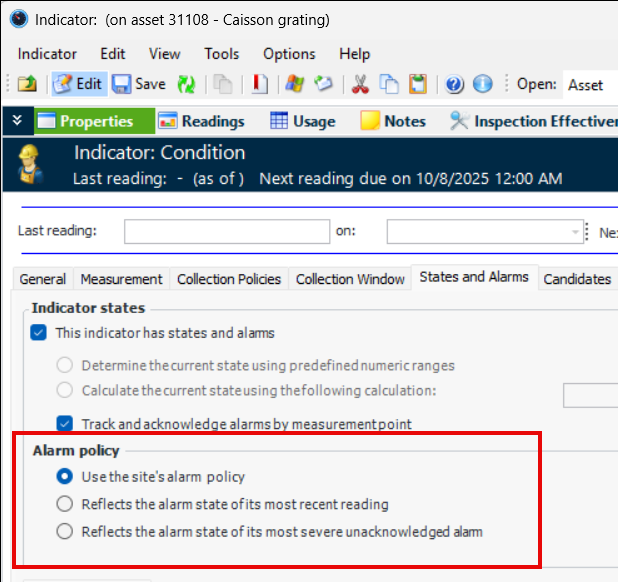
You now have the choice of setting the alarm acknowledgment policy on individual indicators. In the Indicator window, select the Properties view, States and Alarms tab. Make sure the indicator is open for editing. In the new Alarm policy area, the default selection is Use the site’s alarm policy:Defer Processing of Uploaded Checksheets when Approval Required
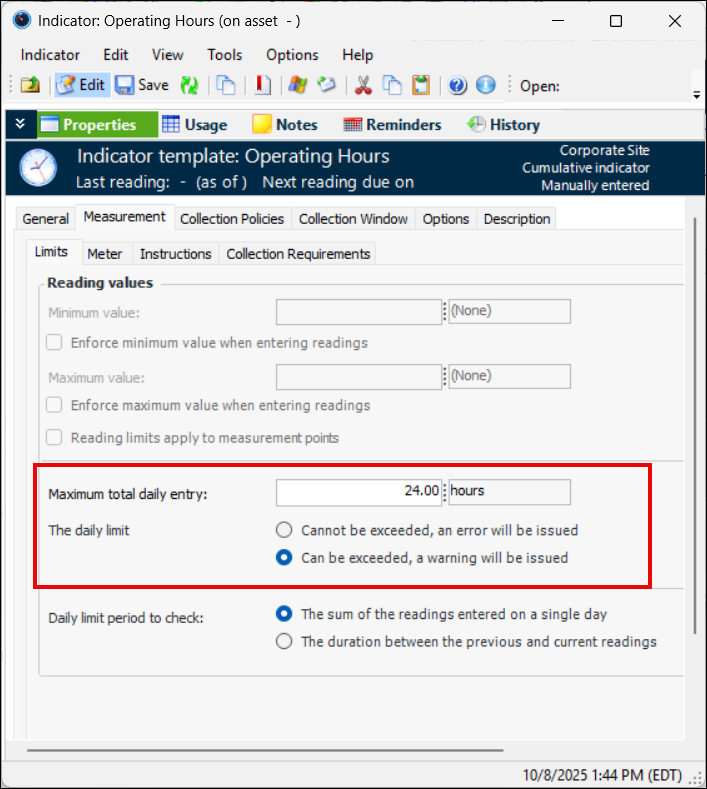
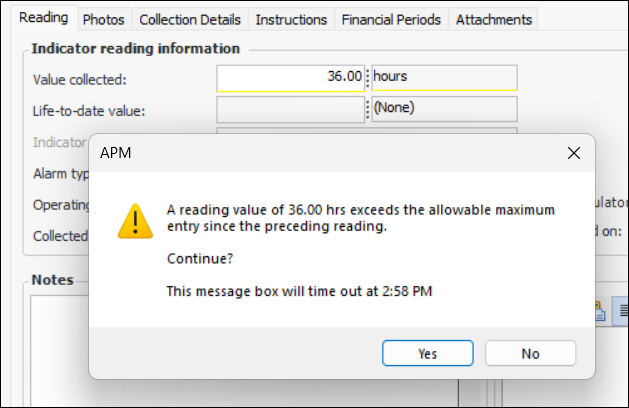
Cumulative Indicator – Warning for Exceeding Daily Limit
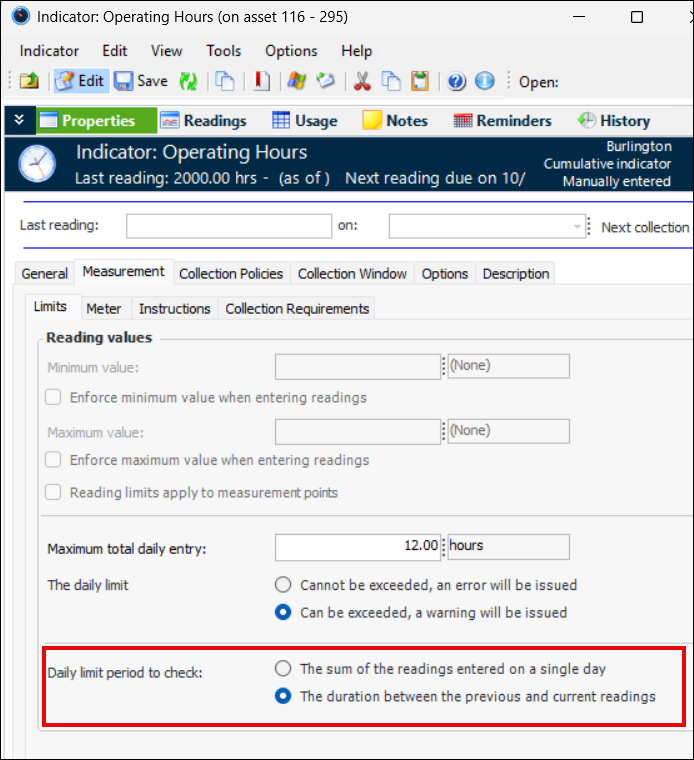
Cumulative Indicator – Daily Limit Period to Check
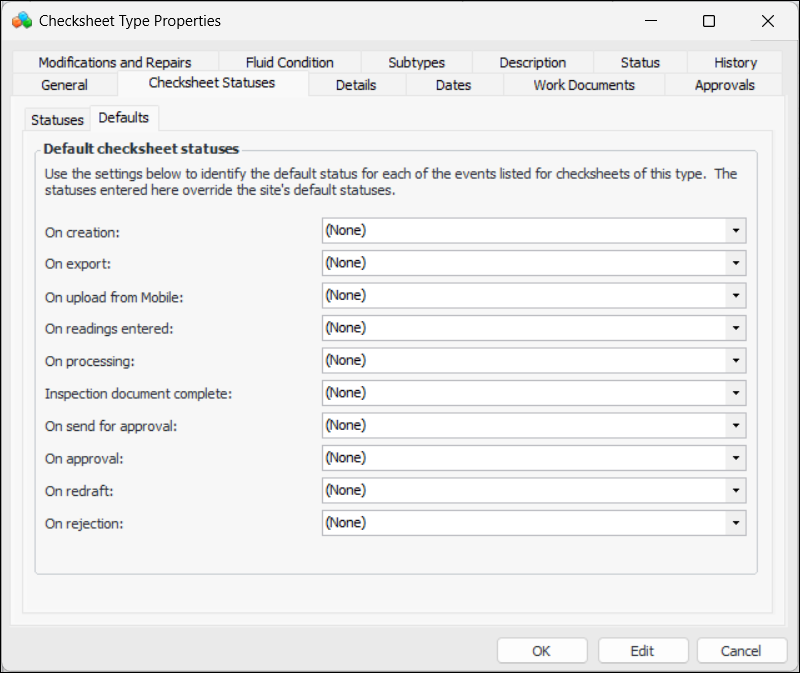
This option is set in the Indicator window, Properties view, Measurement tab, Limits tab. For example:Default Checksheet Statuses Based on Checksheet Type
Indicator Target Property Added to APM Remote
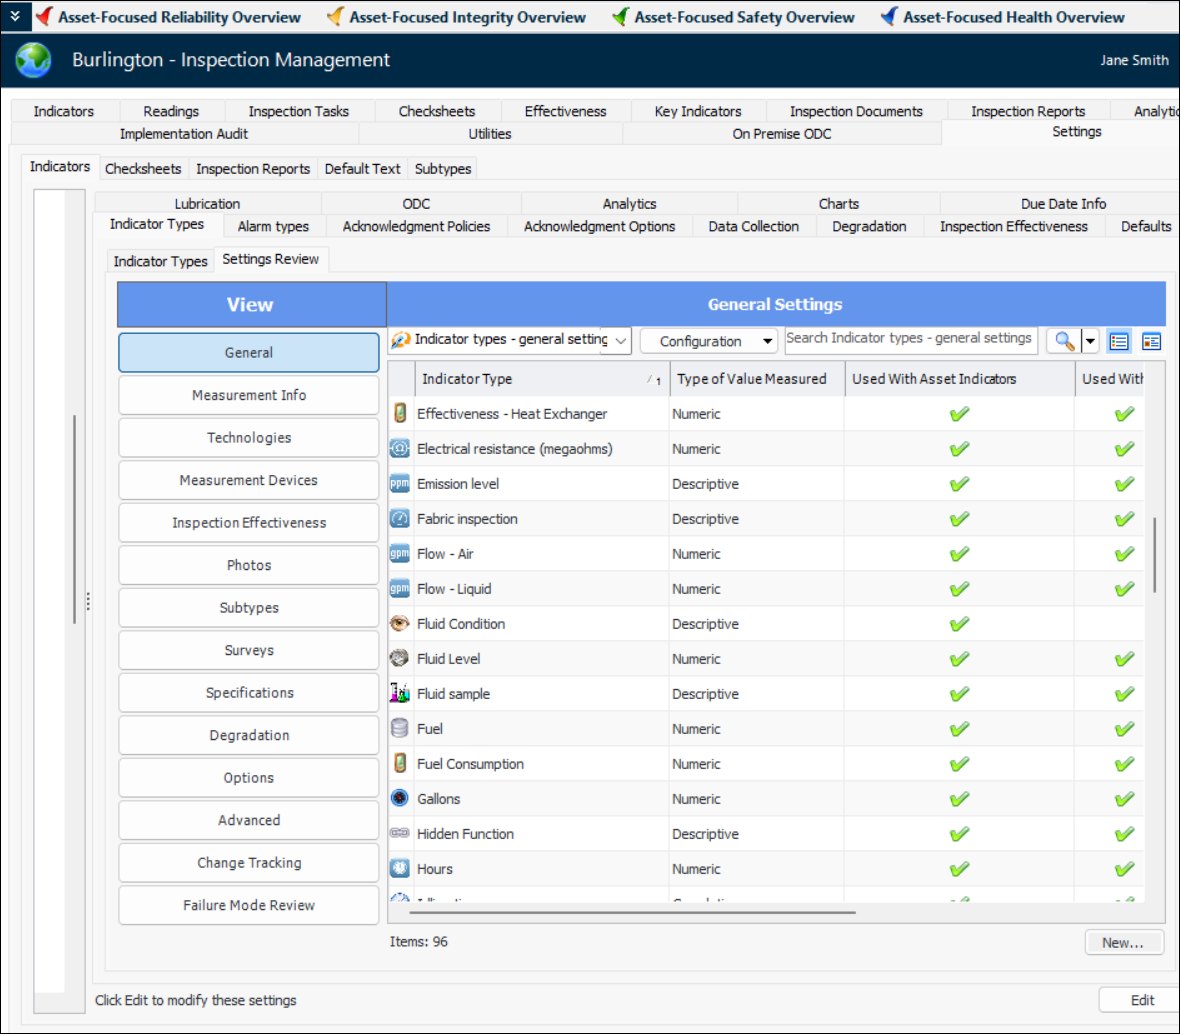
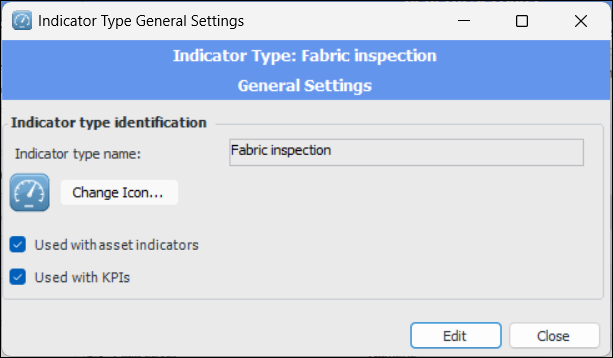
Indicator Types Settings Review
The new Settings Review tab provides an easy way to view, compare, and update settings for all indicator types. In the Site window, select the Inspection Management view, Settings tab, Indicators tab, Indicator Types tab, Settings Review tab:You can modify values in the table using in-line editing (press F2) or the Replace Column Data function. For more information, see Applying Mass Updates.On-Premise Installs with Bentley CONNECT Users
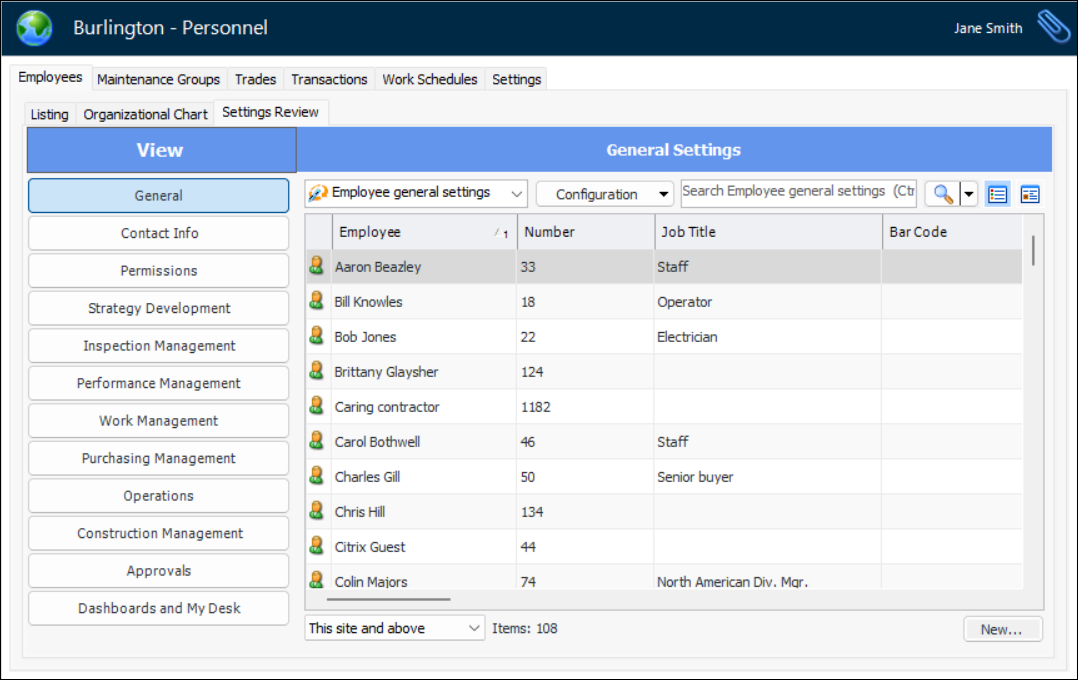
Personnel – Employee Settings Review
The new Settings Review tab in personnel settings provides an easy way to view, compare, and update settings for all employees. In the Site window, select the Personal view, Employees tab, and the Settings Review tab:Select a section on the View column to see information by topic.You can modify values in the table using in-line editing (press F2) or the Replace Column Data function. For more information, see Applying Mass Updates.Reports – Table of Contents
When building an inspection report or work order report with many tasks, you can now add a table of contents so that the viewer can more easily navigate the content and find the details they are looking for. This functionality is provided by a DevExpress® add-in that is fairly easy to use.Site Settings
In the Enterprise window, Sites view, Site Settings tab, the configurations list has been reviewed and updated. A few new configurations have been added: Approvals and RCA. Some existing configurations have been split into multiple configurations, for example, Maintenance Settings was renamed Asset Settings, and Interop Work Settings and EAM Work Settings were added.Standard Tasks
Strategy Development Analysis
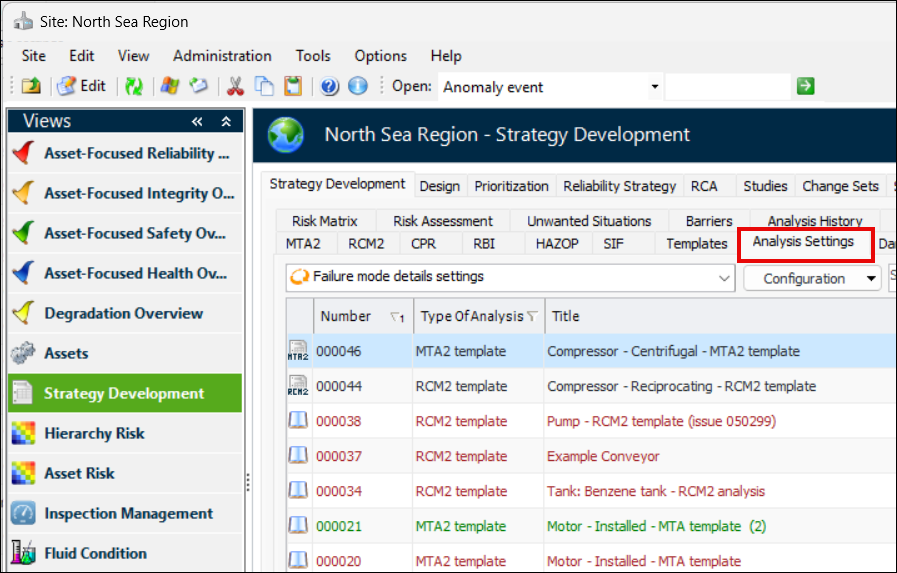
Strategy Development Analysis Settings on Site
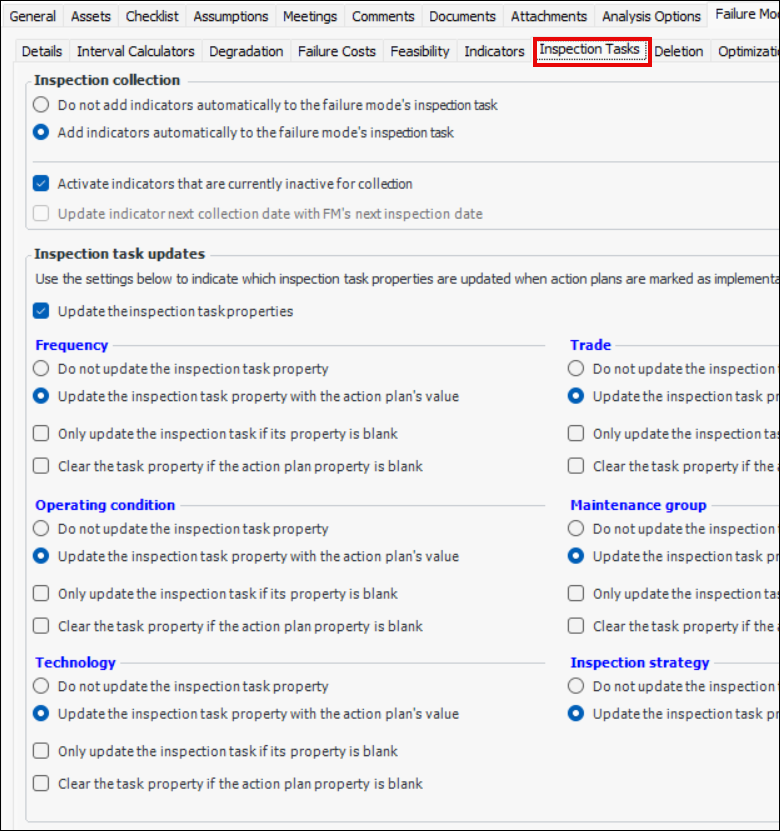
The new Analysis Settings tab in the Strategy Development view and tab in the Site window provides configurations that allow you to view, compare, and update settings on all of the analyses in the site.You can use the Replace Column Data function to update settings for groups of analyses or analysis types. For more information, see Applying Mass Updates.Double-click an item in the table to open a dialog where you can edit the setting for that analysis.Copying Action Plan Properties to Inspection Tasks
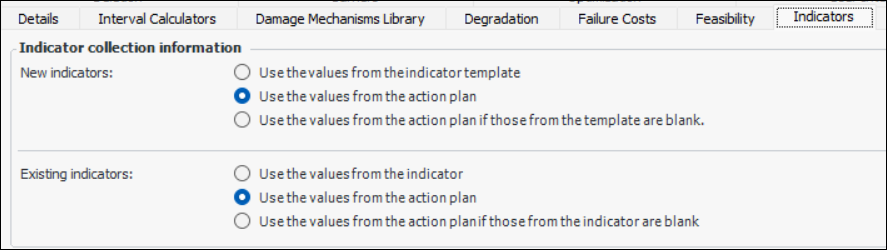
The settings are located in analysis types and individual strategy development analyses. In an analysis’ Properties view, select the Failure Mode Options tab and the new Inspection Tasks tab.Note: We recommend changing your current analyses to use the new settings if you have set existing indicators to be updated from action plans using the Indicators tab:RCM2 Consequence Evaluation
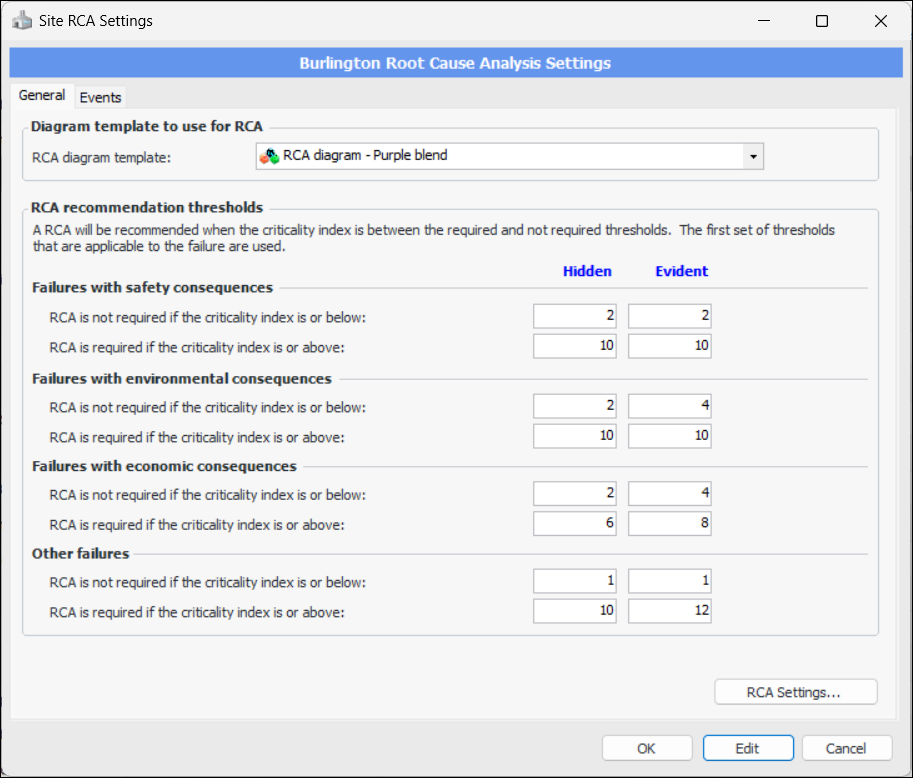
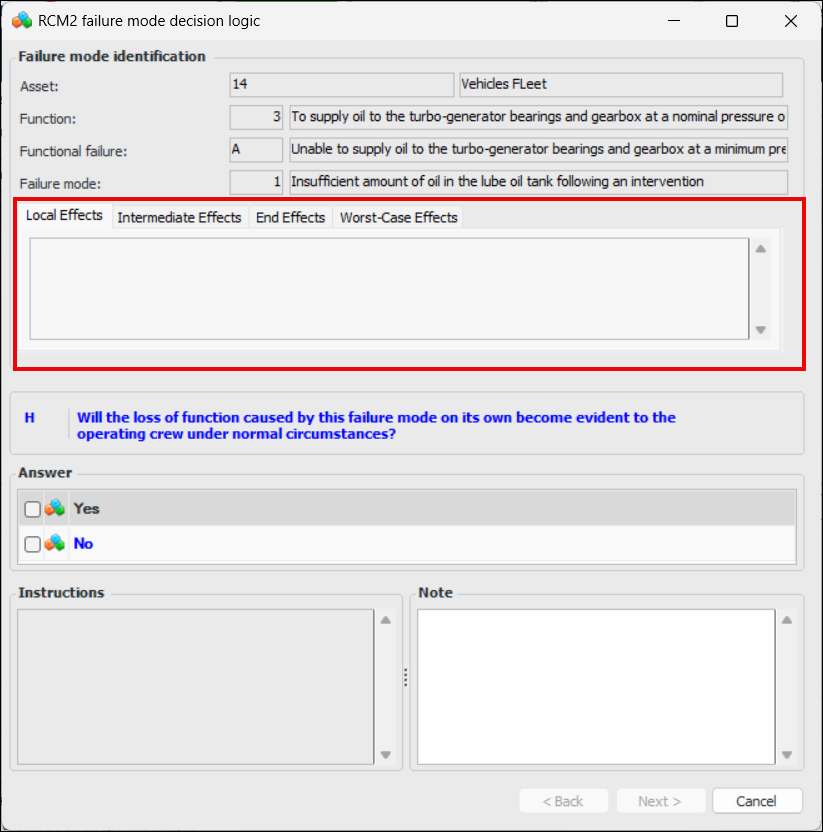
Root Cause Analysis (RCA) – Support for Asset Types
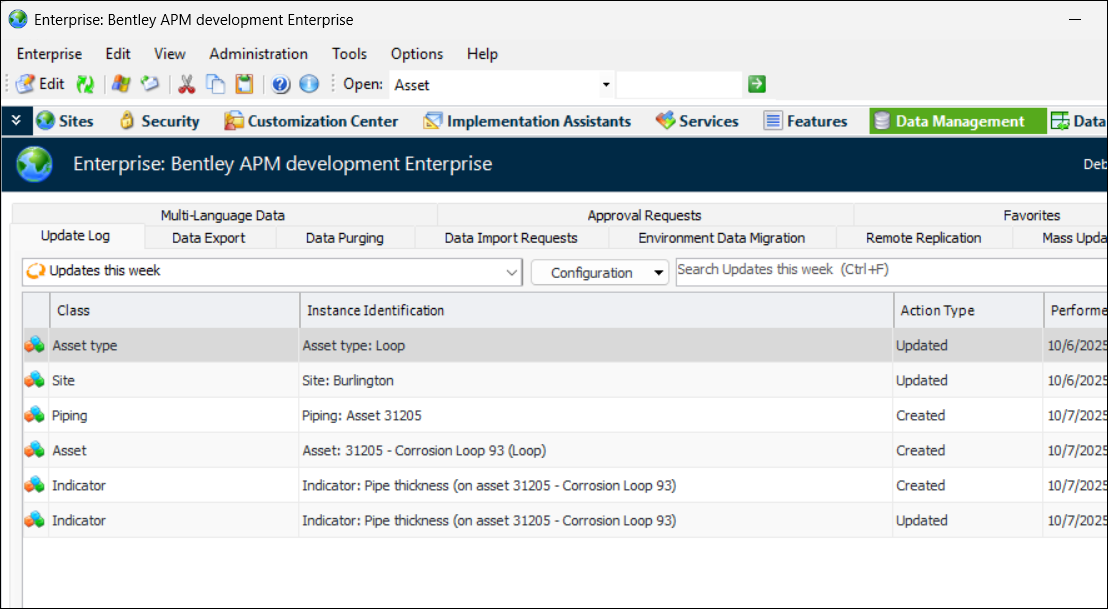
Updated Objects
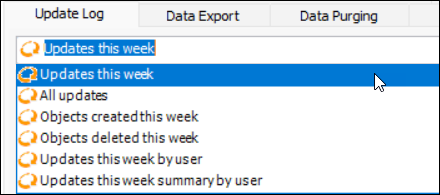
In the Enterprise window, select the Data Management view and the Update Log tab. The “Updates this week” configuration lists the objects that you updated in the past week, for example:
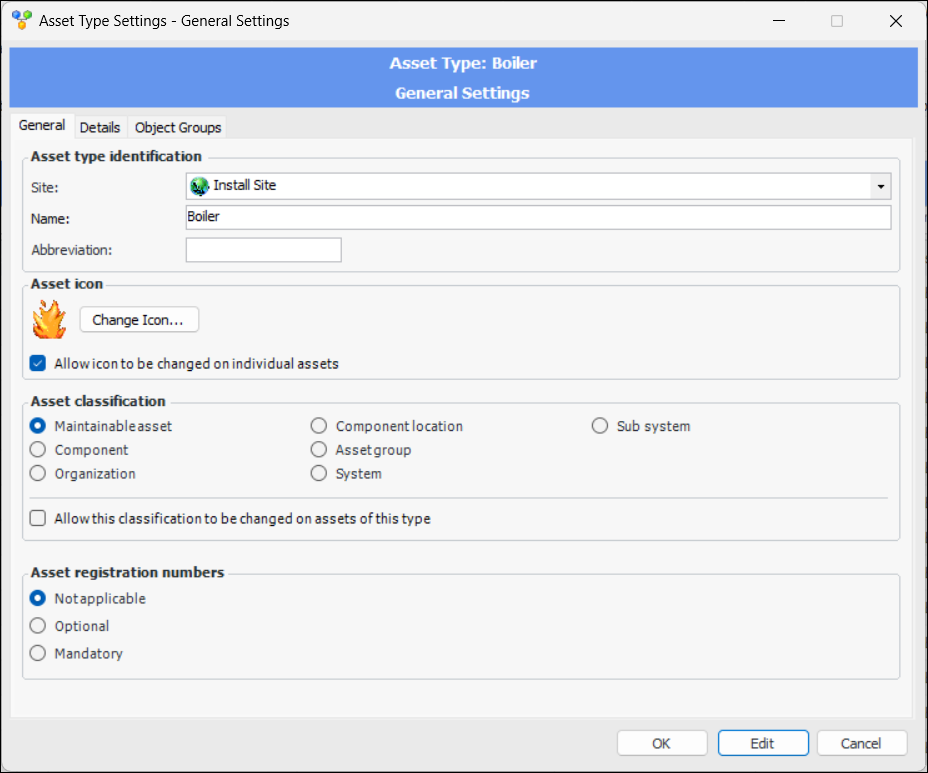
 to view as Form
  to view, update, and save an individual asset type and move on to the next using the navigation buttons.