
|
|
What’s New in APM 25.0.1
Contents
Assets
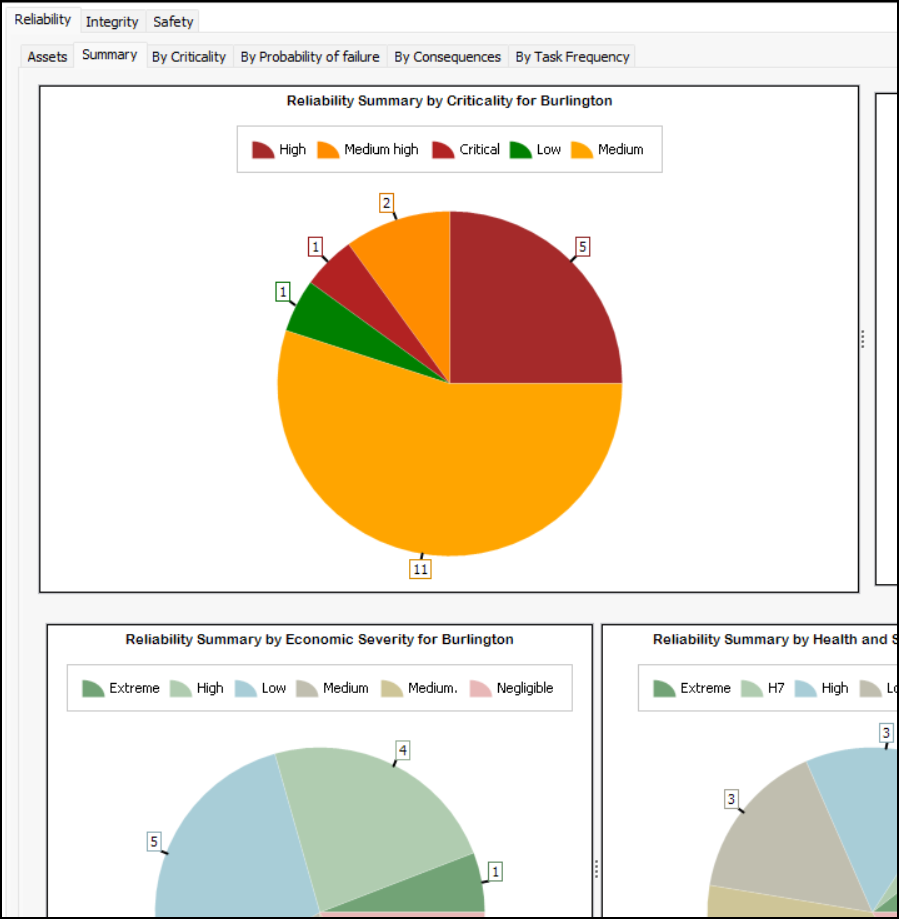
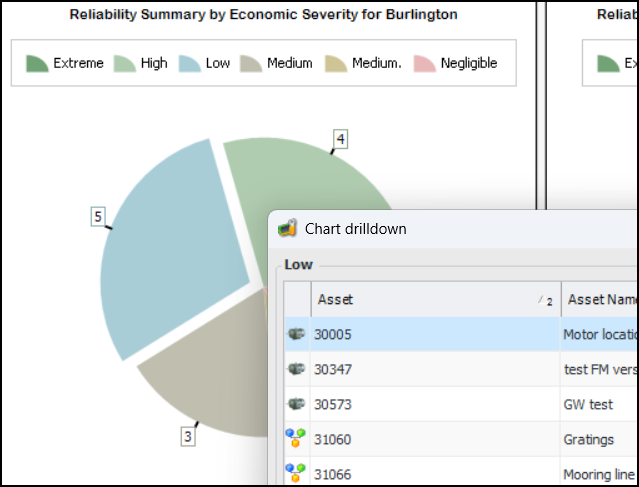
Risk Views – Summary Charts
In the Hierarchy Risk and Asset Risk views in the Site window, you can now select the Summary tab to view reliability summary charts by:Each of the Reliability, Integrity, and Safety tabs contains a Summary tab. Here is an excerpt from the Site window’s Asset Risk view, Reliability tab, Summary tab:Note: Asset hierarchy risk summaries are “generally available” product features. You must first enable features 121 and 137 to use the functionality in APM. In the Enterprise window, select the Features view and the Enabled Features tab. Click Browse, select “Asset risk summaries” and “Asset hierarchy risk summaries”, and click OK. If APM is running as a smart client, click Refresh Enabled Features on the server. Then restart the client to use the functionality.Audit History
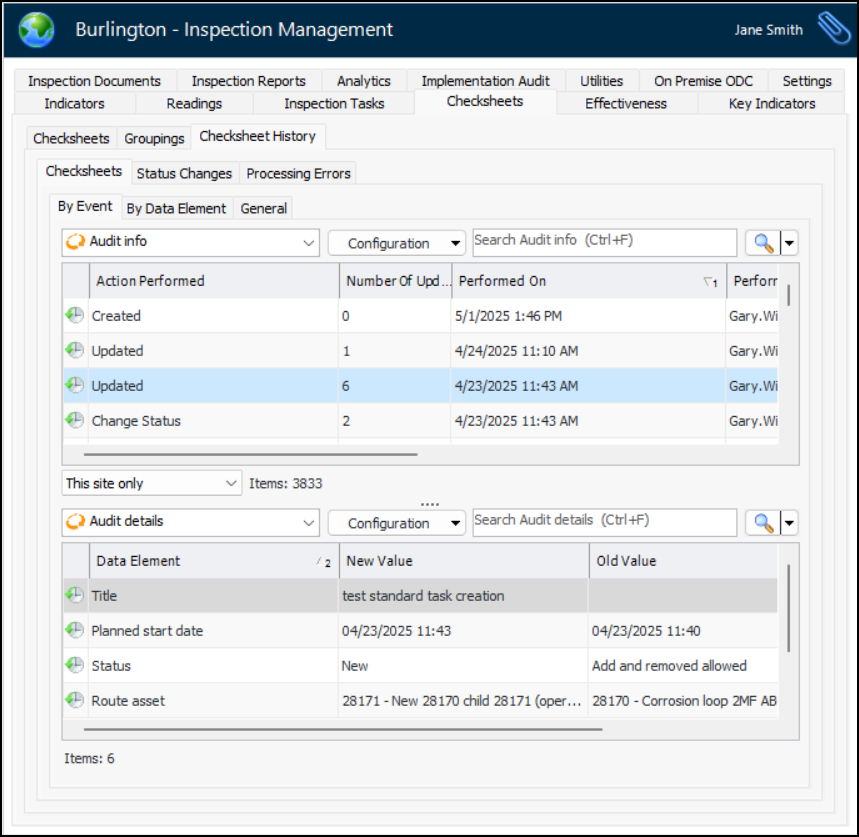
Historical information is now available for a number of APM objects at the site level. You can view audit information and details for checksheets, assets, and standard tasks. For example, in the Site window, select the Inspection Management view, Checksheets tab, and Checksheet History tab:In the By Event tab, when you select an action in the Audit info table, the Audit details table displays specific information for that action.Select the By Data Element tab to view audit details for each data element (for example, Next collection due). Select the General tab to view creation and last update information for each checksheet.By default, each tab displays information for the current site. You can select This site and above or This site and below from the list at the bottom of the main table.To view asset audit information at the site level, select the Assets view and the Asset History tab. You will see the same information that is available on the History view of an asset’s window, with the exception of data loaders and activity reports.To view standard task audit information at the site level, select the Reliability Program view, Program tab, and Task History tab. The same information that is available on the History view of a task’s window, with the exception of activity reports, review requests, and data loaders, is displayed here. You will also find historical information for inspection tasks in the Inspection Management view.Audit information is now available for operating parameters. In the site window, select the Assets view and Operating Parameters tab. Open an operating parameter’s window and select the History tab. Standard information is available on the By Event, By Data Element, and General tabs.Function and Functional Failures
The same History tab has been added to the RCM2 Function and RM2 Functional Failure dialogs that you will find in RCM2 analyses, RCM2 templates, and design FMECAs. The History tab displays standard audit information by event, by data element, as well as audit detail and general information.Charts and Gauges
Gauges
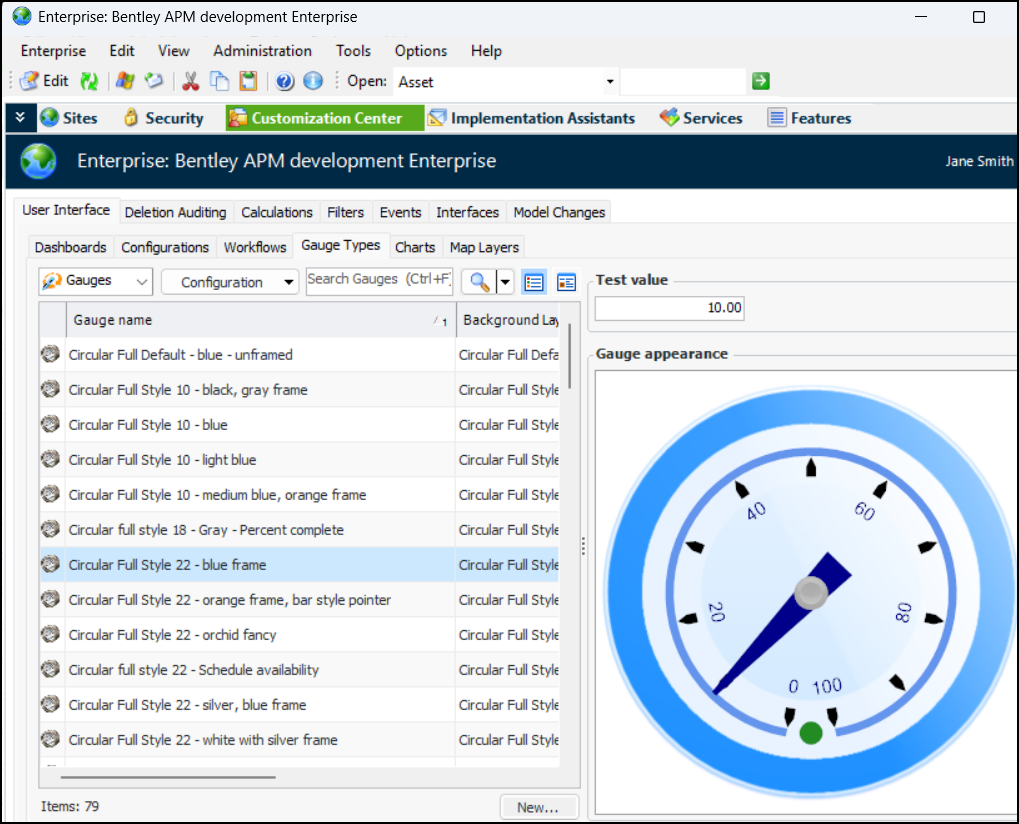
All of the gauge appearances have changed in version 25.0.1. We recommend reviewing all of the gauges that you use and replacing them as required. In the Enterprise window, select the Customize Center view, User Interface tab, Gauge Types tab. Select a gauge in the table to view it in the Gauge appearance pane:Charts
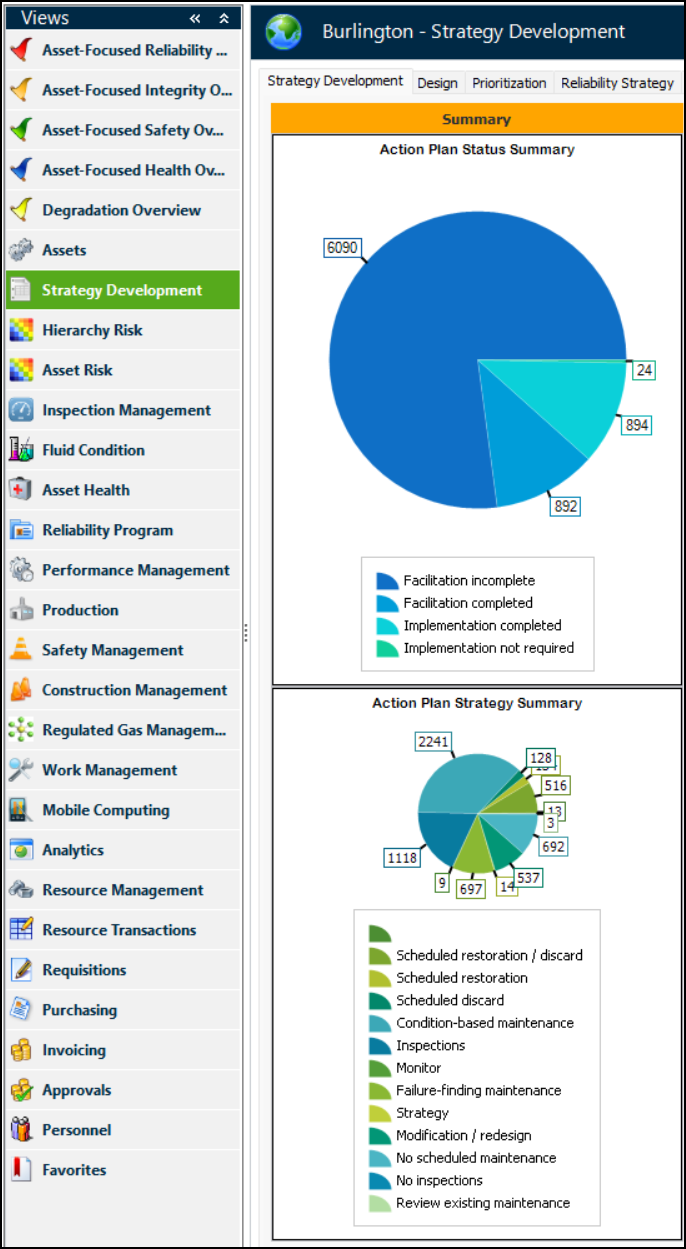
Chart appearances have also been refreshed in this release. For example, when your employee options specify that APM standard sidebars are shown in the user interface, the Strategy Development view displays Summary sidebars similar to these:Alarm Type Charts
Construction Management
Supervisor Checksheets
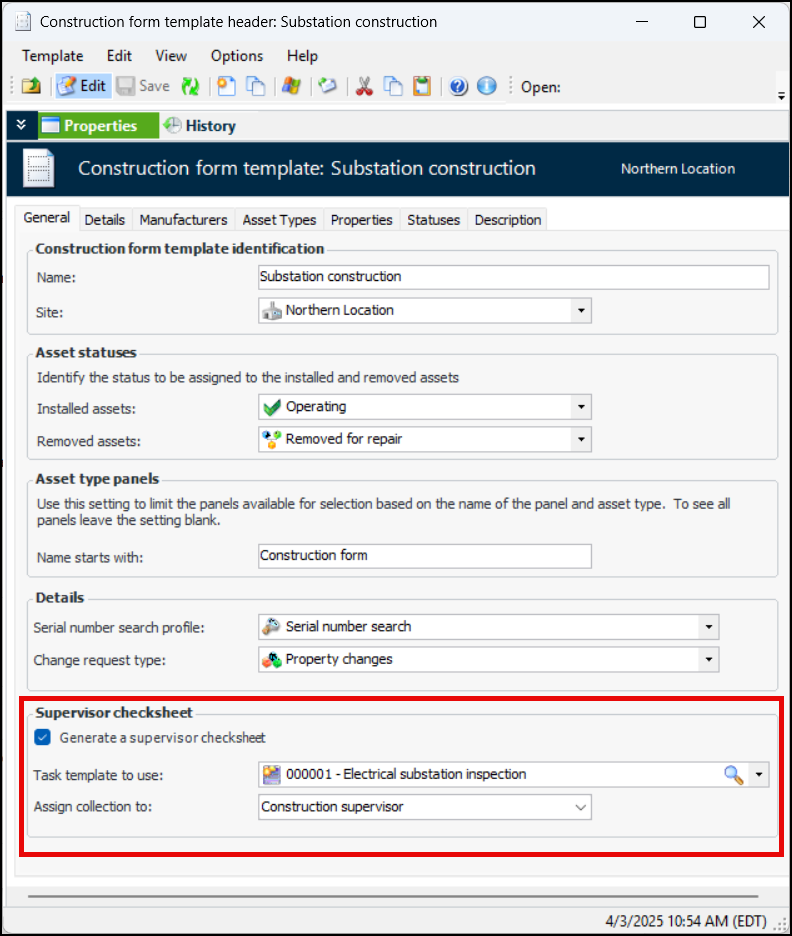
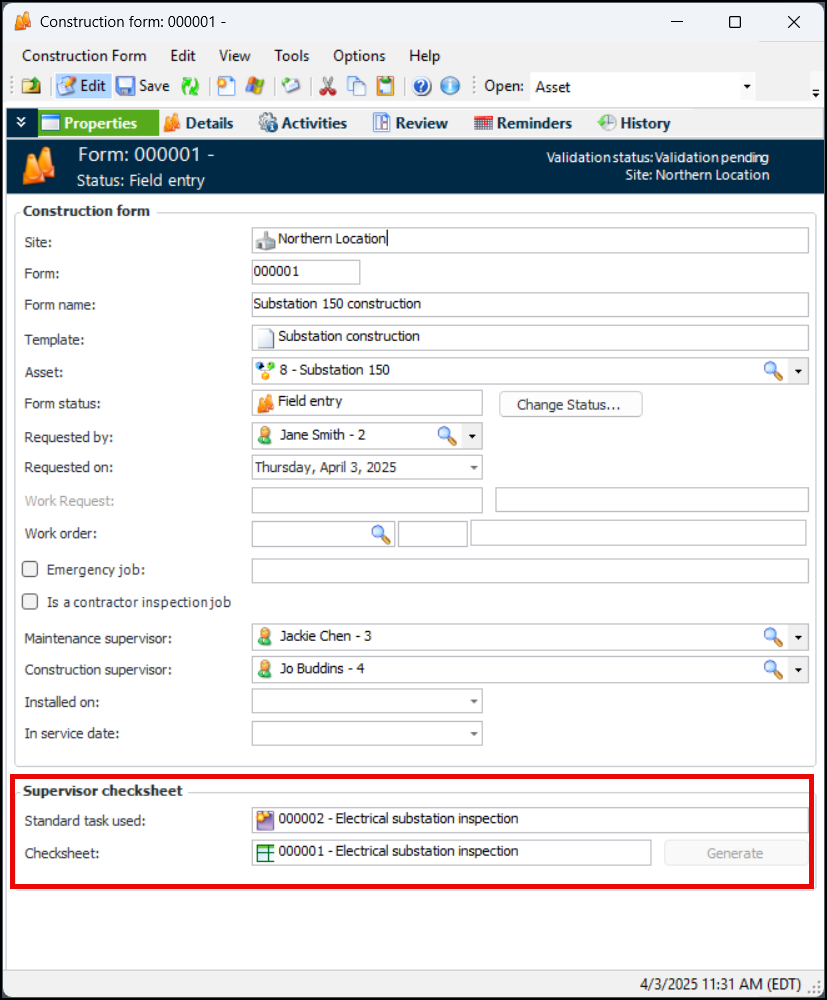
To set up this functionality, open the construction form template. In the Construction Form Template Header window, select the Properties view and General tab. In the Supervisor checksheet area, select Generate a supervisor checksheet. Select a standard task template to use. If you wish, assign collection to the maintenance or construction supervisor on the construction form. For example:Construction form status properties now include an action for generating the supervisor checksheet and a rule that controls checksheet generation. For more information, see Setting up Statuses for Construction Forms.Adding Descendant Assets to Construction Forms
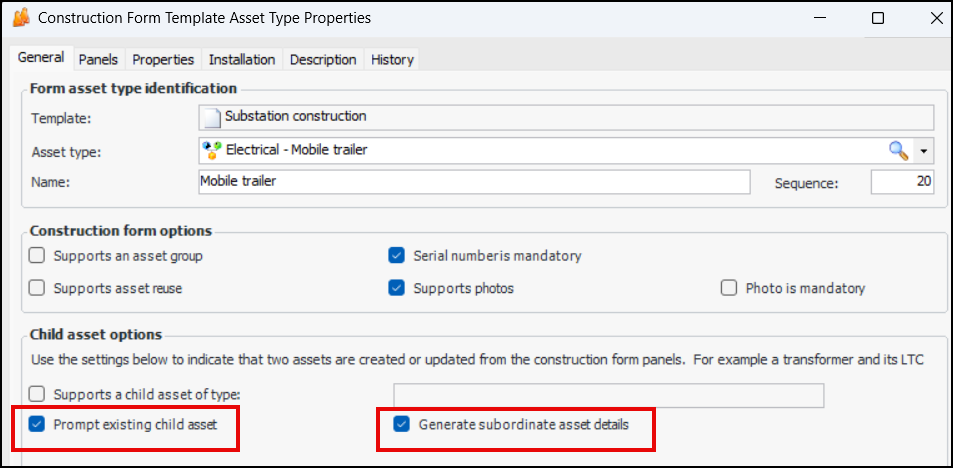
To set this up on a construction form template, open the asset type for the parent asset (for example, Mobile Trailer). In the Child asset options area, select Prompt existing child asset and Generate subordinate asset details.Data Loading – Standard Task
Note: Active/inactive task support is only available when AssetWise Enterprise Interoperability is active.Fluid Condition – Indicator Bar Code
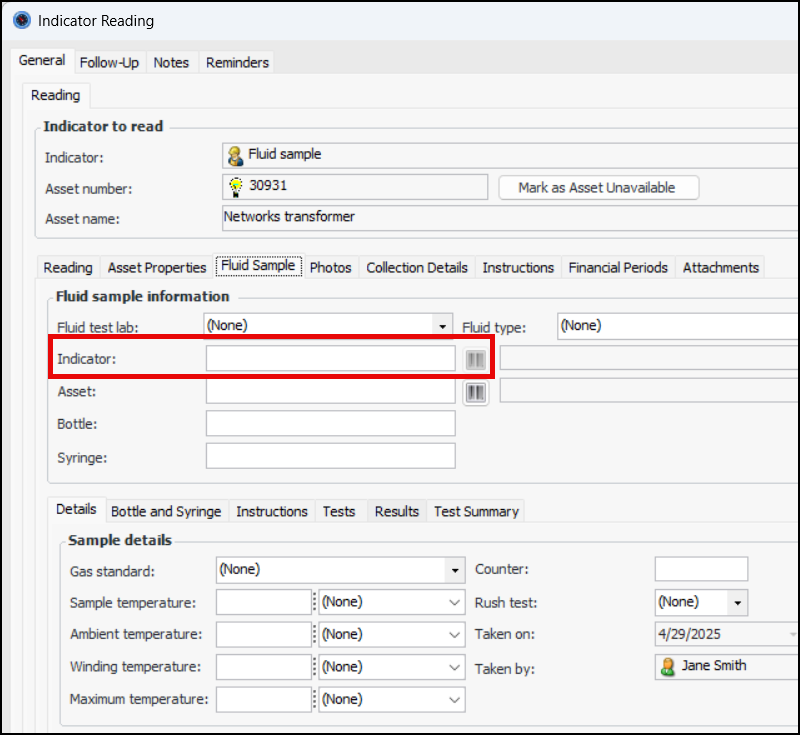
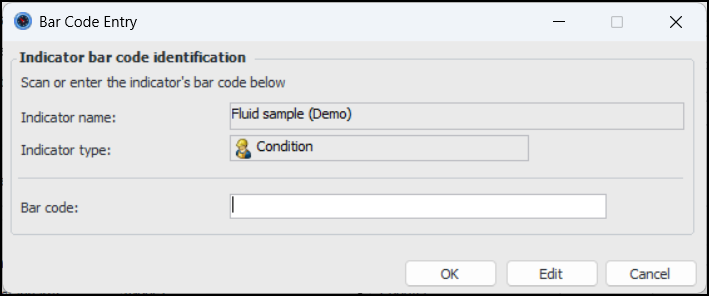
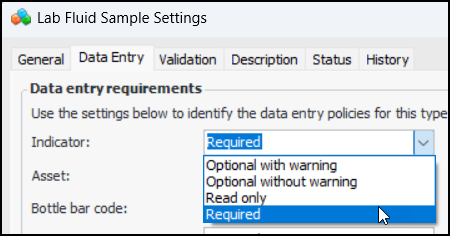
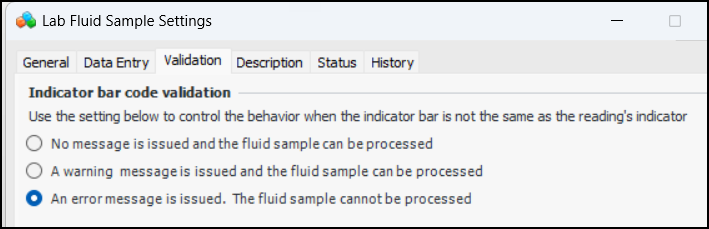
When entering a fluid sample indicator reading, select the “sample taken” indicator state to view the Fluid Sample tab. You can now enter or scan the indicator bar code:Enter or scan the bar code and click OK. The bar code is added to the indicator and the fluid sample information.To set up APM to use indicator bar codes, update lab fluid sample settings. On the Data Entry tab, select the data entry policy for indicator bar codes on fluid samples:Select the Validation tab to select an option for indicator bar code validation.Inspection Management
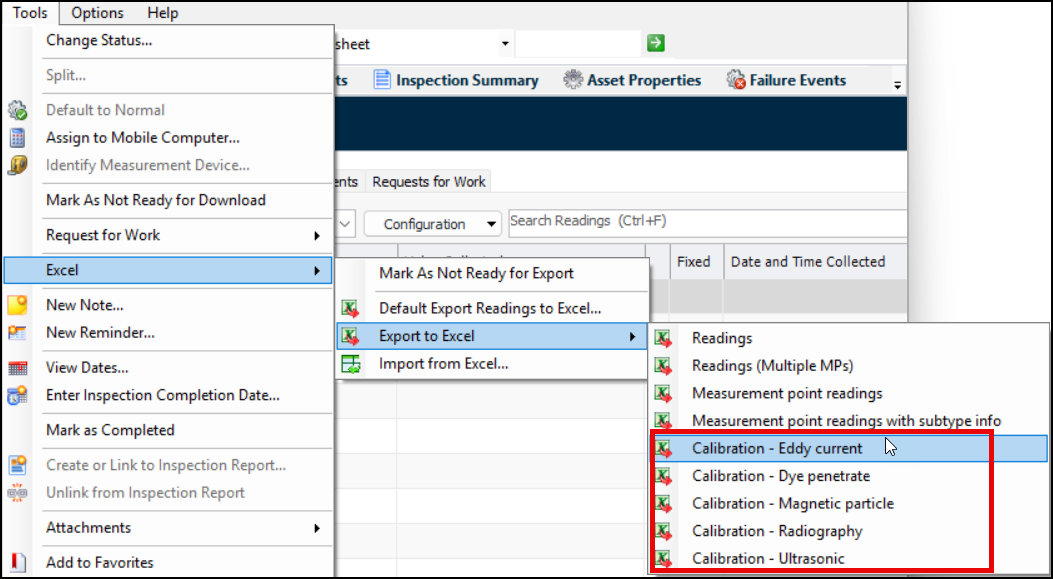
Export Checksheet Subtype Calibration Readings to Excel®
When exporting a checksheet, click the Tools menu, Excel, Export to Excel and then the type of calibration:Checksheet Properties View
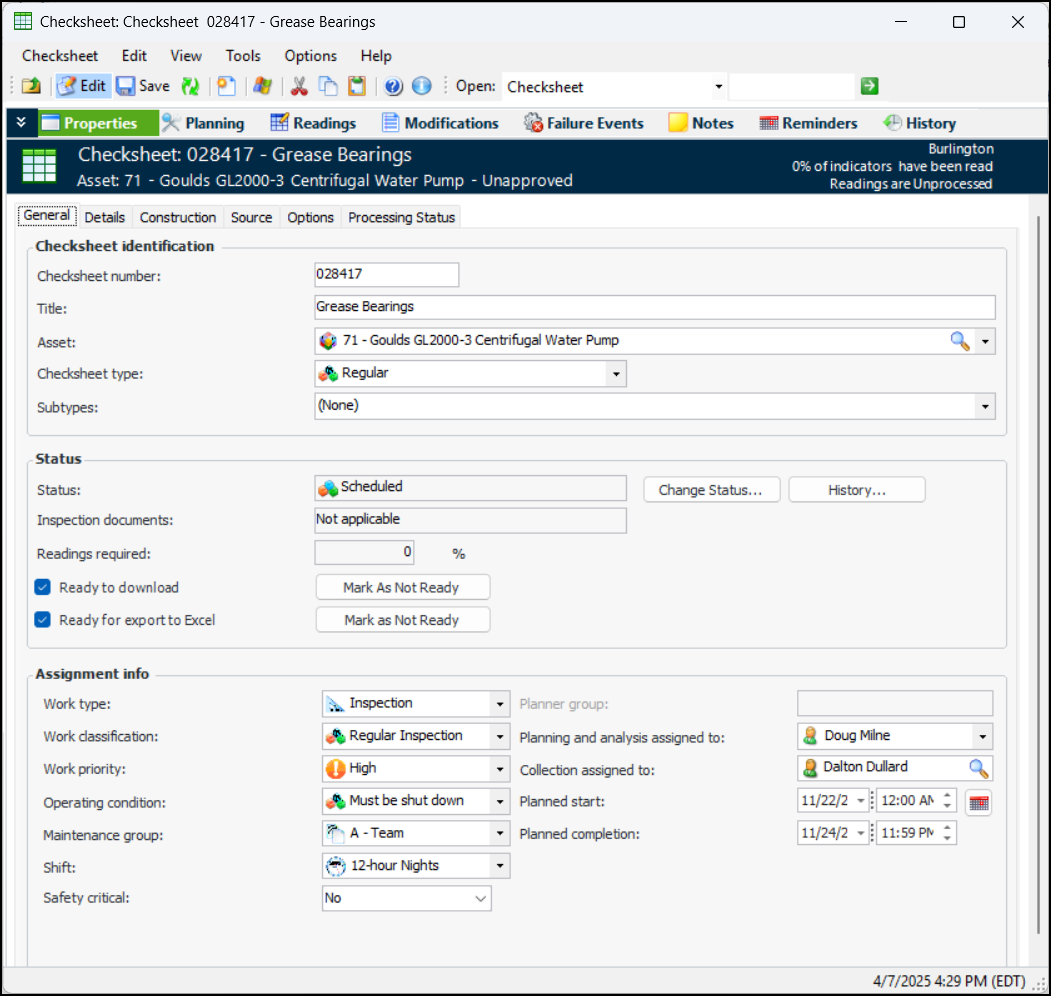
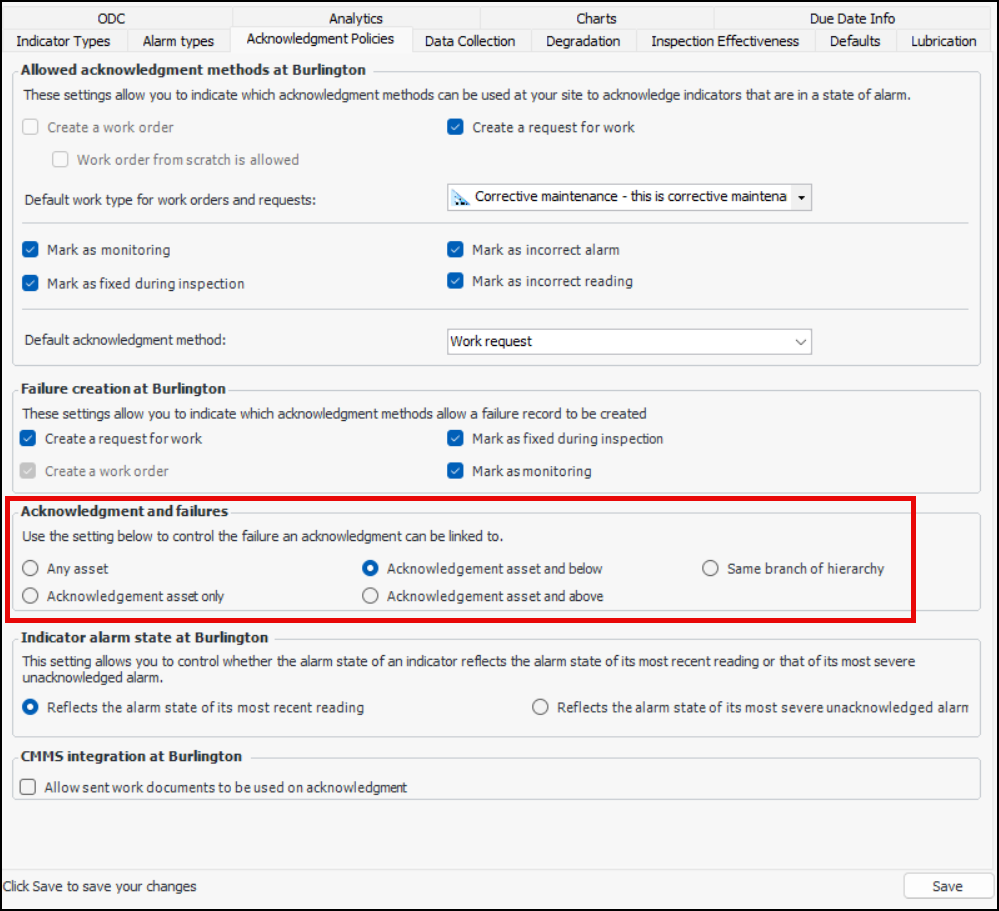
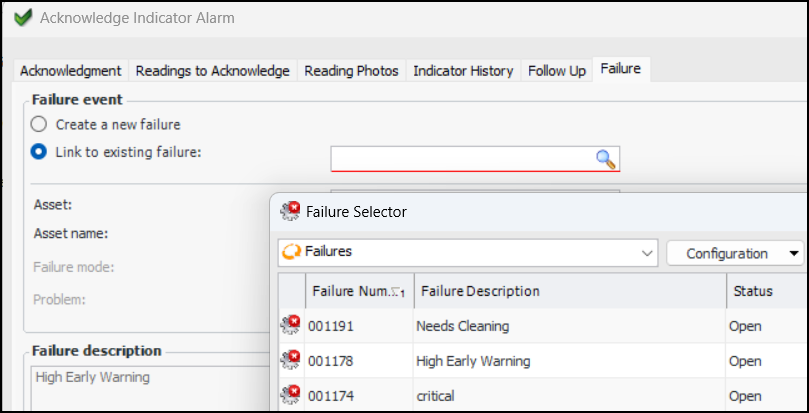
In the Checksheet window, the Properties view has been reorganized to make information easier to find. For example:The new Options tab contains settings for:Alarm Acknowledgments – Link to Failures
Acknowledgment Windows Show Links to Work Documents
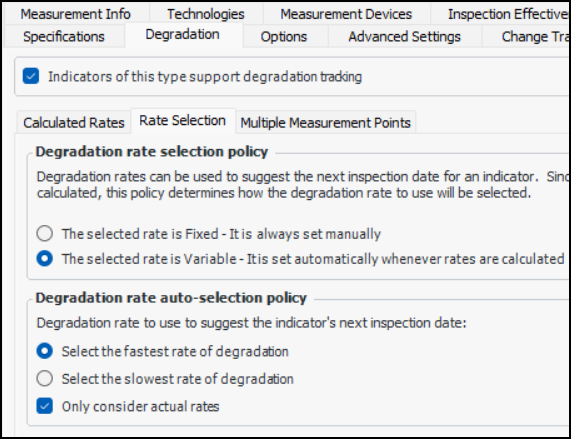
Degradation Tracking on Indicators
Performance and Stability Enhancements
Strategy Development Analysis
Study Statuses – Properties Cannot be Updated
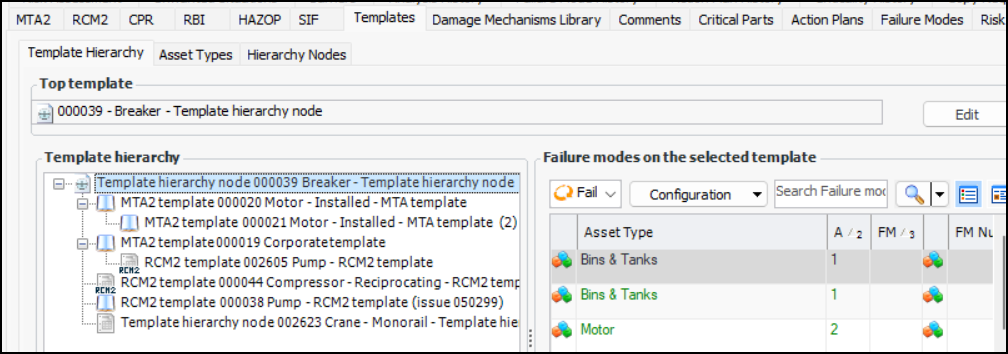
Template Hierarchies
The top template is shown above the tree. You can click Edit to select another template and then click Save to update the tree.Select a template in the left-hand table to view the asset types and their failure modes on the right. Select the Asset Types tab to view a table of asset types and the number of templates for each type. Select an asset type to view a list of its template analyses.The Hierarchy Nodes tab makes it easy to view and add nodes for use in template hierarchies.Template Creation from Site
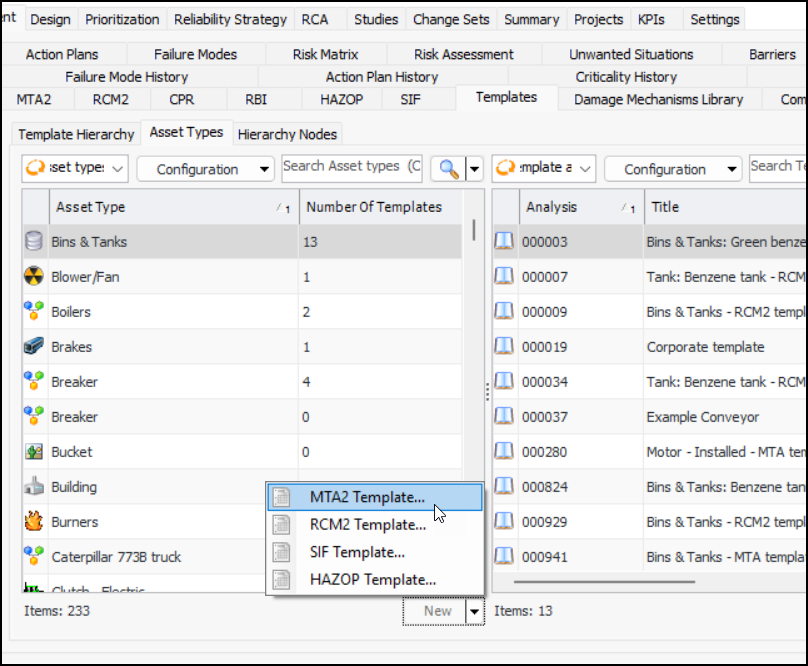
You can now create templates for MTA2, RCM2, SIF, and HAZOP analyses from the Site window, Strategy Analysis view, Templates tab, Asset Types tab. Select the asset type in the table, click the New list and select the type of template:Strategy Development Analysis – Design FMECA
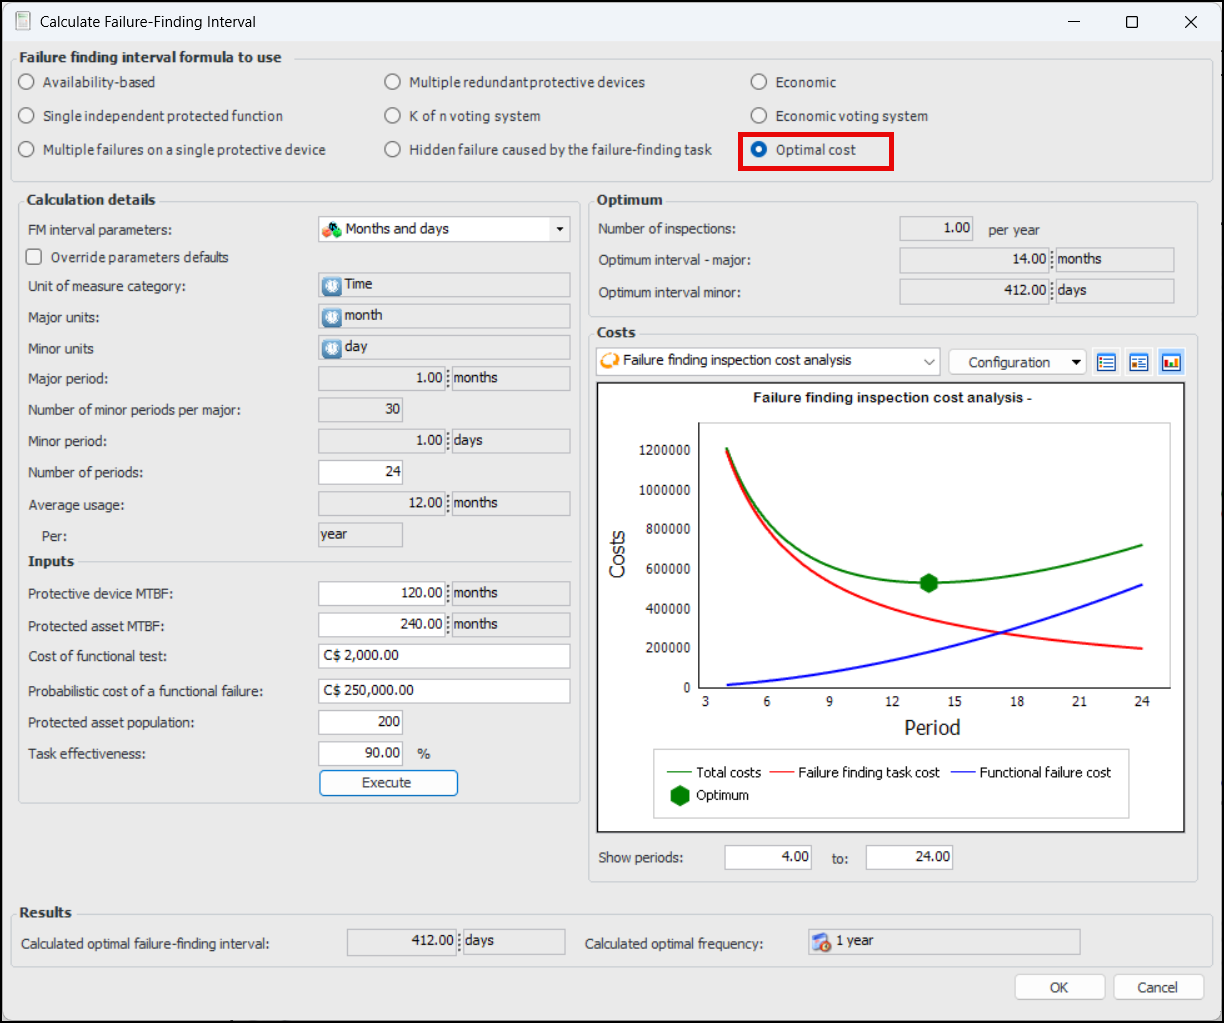
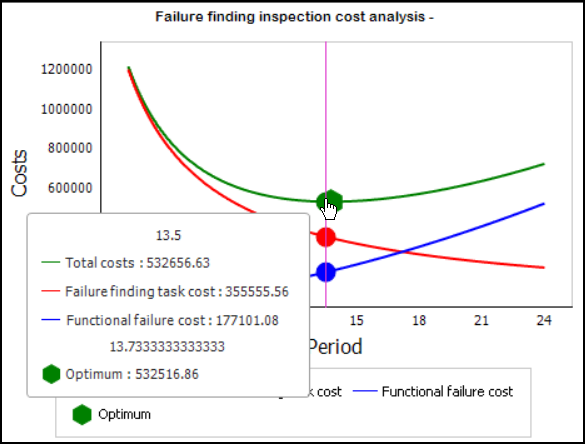
Note: Design FMECA is available for technology preview. You must first enable feature 140 to use the functionality in APM. In the Enterprise window, select the Features view and the Enabled Features tab. Click Browse, select “Design FMECA” and click OK. If APM is running as a smart client, click Refresh Enabled Features on the server. Then restart the client to use the functionality.New Failure-finding Inspection Interval Calculation
Note: The Optimal cost calculation is a “generally available” product feature. You must first enable feature 141 to use the functionality in APM. In the Enterprise window, select the Features view and the Enabled Features tab. Click Browse, select “Optimal cost calculation for Failure Finding Interval” and click OK. If APM is running as a smart client, click Refresh Enabled Features on the server. Then restart the client to use the functionality.

 to see the figures.