|
|
What’s New in APM 24.0.2
Contents
Asset-Focused Overviews
New Overviews
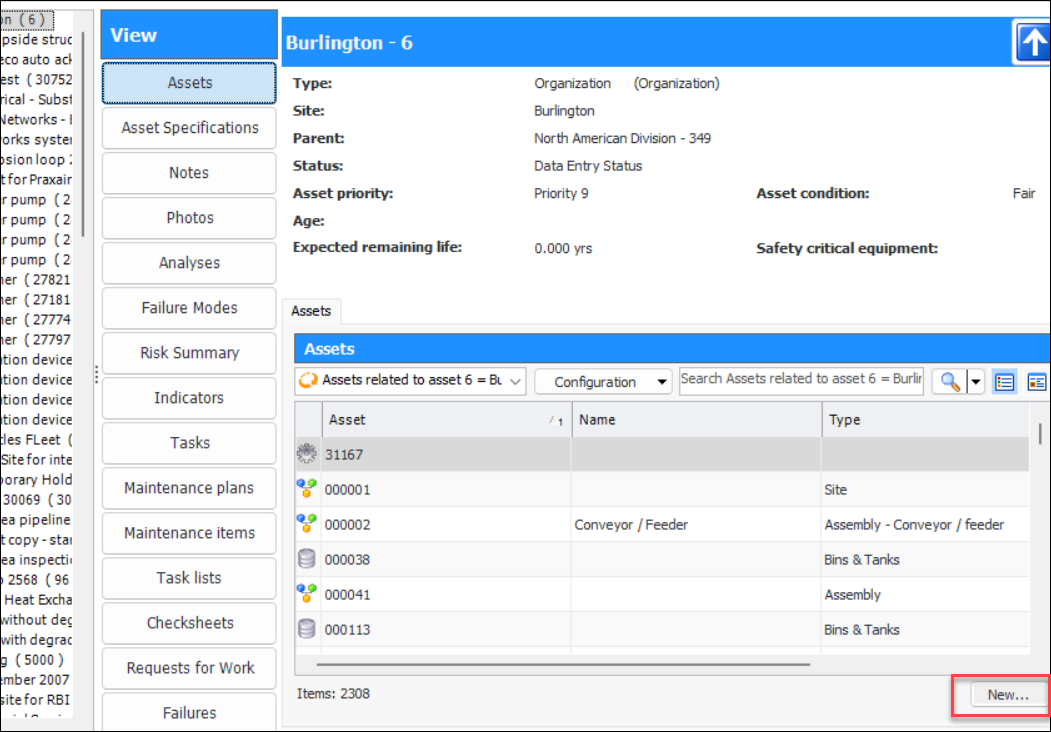
Create Objects from an Overview
You can now add a new object from several of the views in an overview. Look for the New button in lower right corner:Asset Risk Summaries
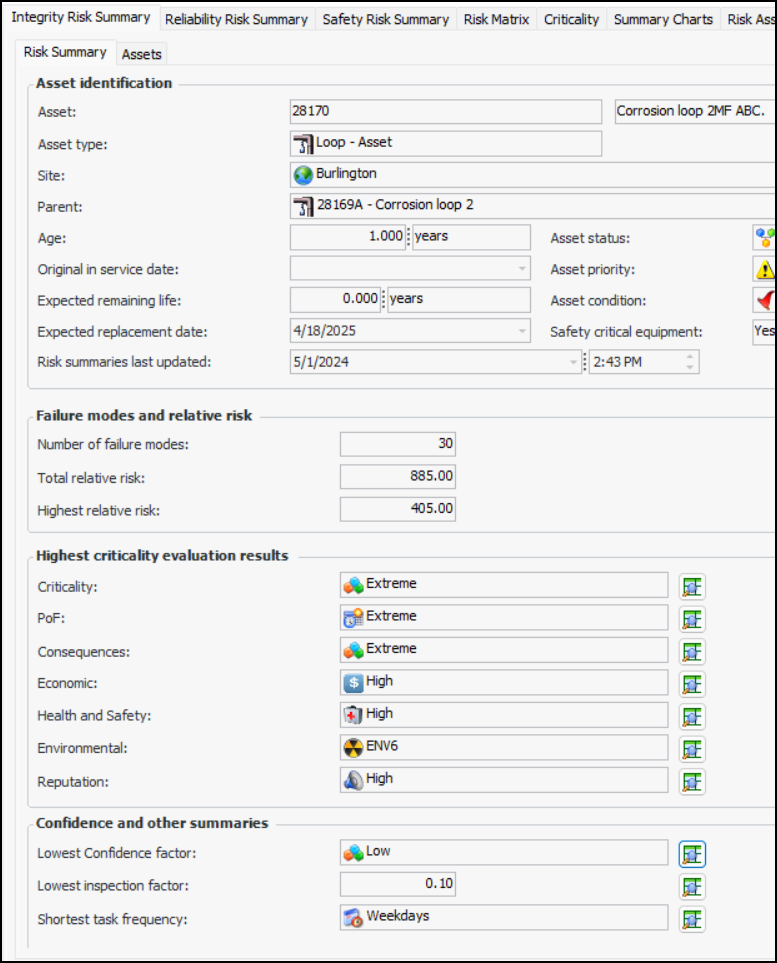
Viewing Risk Summaries
The data is derived from risk assessments on the asset’s failure modes. Summaries are available for:Note: The asset risk summaries are generally available in APM. You must first enable feature 121 to use the functionality. In the Enterprise window, select the Features view and the Enabled Features tab. Click Browse, select “Asset risk summaries” and click OK. If APM is running as a smart client, click Refresh Enabled Features on the server. Then restart the client to use the functionalityTo view risk summaries, open the Asset window, select the Risk Assessment view, and the appropriate Risk Summary tab. Here is an example of an Integrity Risk Assessment:Each summary is based on the asset’s failure modes for which criticality evaluation was performed, as long as the failure modes are marked “implementation completed”. Only primary action plans are considered, with the exception of Shortest task frequency, which includes secondary action plans as well. If versions are in use, only the current version of the failure mode is included.Clickfor any of the values to open a dialog listing failure modes that represent that value. In the example, you could open the dialog next to Criticality to view a list failure modes with the criticality score of “Extreme”.
The Assets tab shows a list of assets in the same branch of the hierarchy with their summaries.You can update an asset’s risk summaries: click the Tools menu and then Update Risk Summaries. All of the risk summaries for the asset are recalculated. To update all of the risk summaries for the site, click the Tools menu, Strategy Development, and Update Risk Summaries. You can also set up the Update Risk Summaries scheduled action to perform the function automatically on schedule.Viewing Assets with Similar Risk
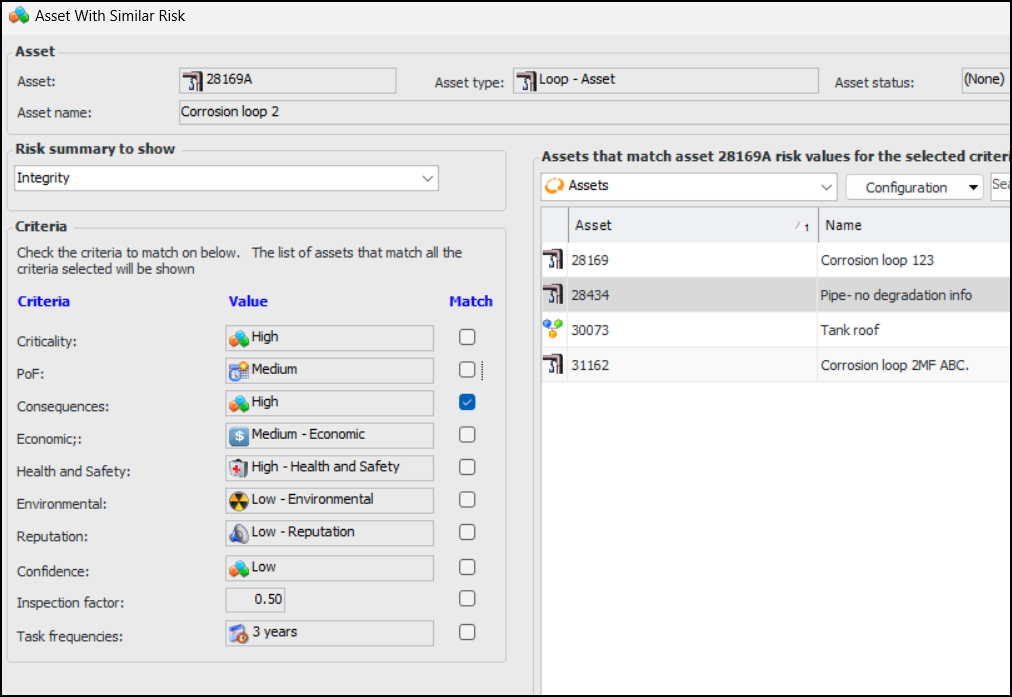
Using this tool, you can view all assets on the site that share criteria values. To view assets with similar risk, open the Asset window, click the Tools menu and then Similar Risk Profile. The Asset with Similar Risk window opens. For example:You can select one or more criteria from the Match list. The “Assets that match” table has columns showing risk information.AWEIS – Breakdown Properties
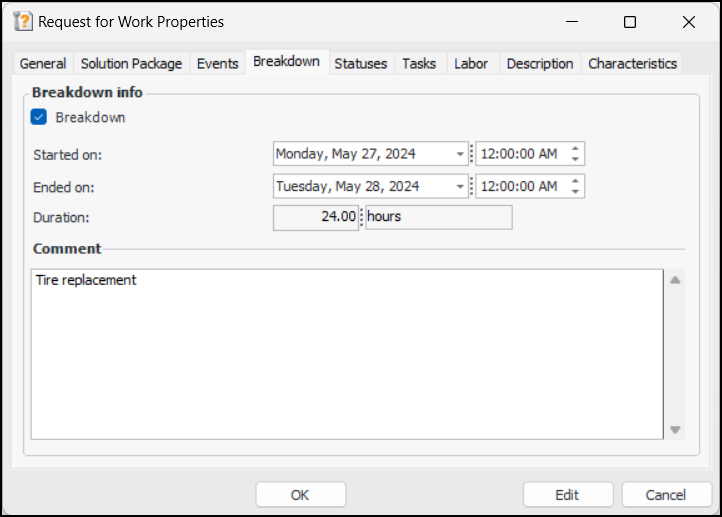
Breakdown Properties
The Breakdown tab is also available on interop work requests and work orders.The BOD Definitions and CCOM samples have been updated.AWEIS – Labor Requirements
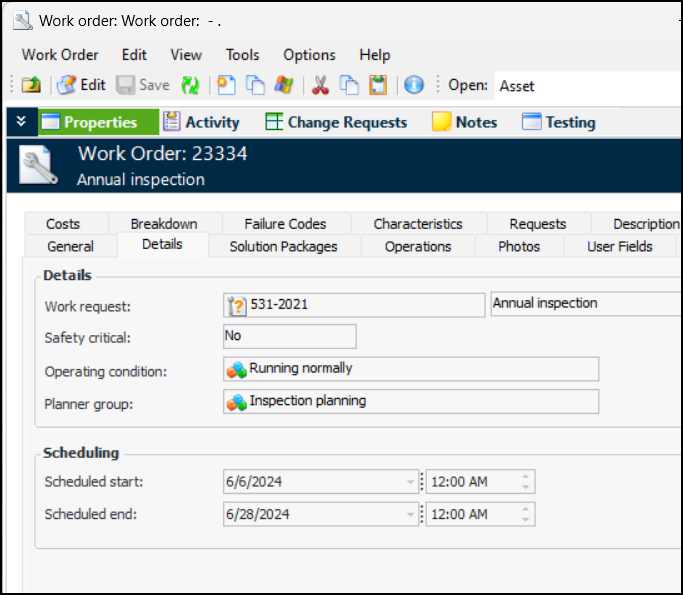
AWEIS – Requests for Work Linked to Work Orders
When an interop work request is created as a result of a request for work, the interop work order that is subsequently created now contains a reference to the original request for work. In the Request for Work window, select the Work tab to view the resulting work documents. Not only does this allow you to see the work order associated with the request for work, but it allows the checksheet’s status to be synchronized with the work order status.AWEIS – Solution Packages
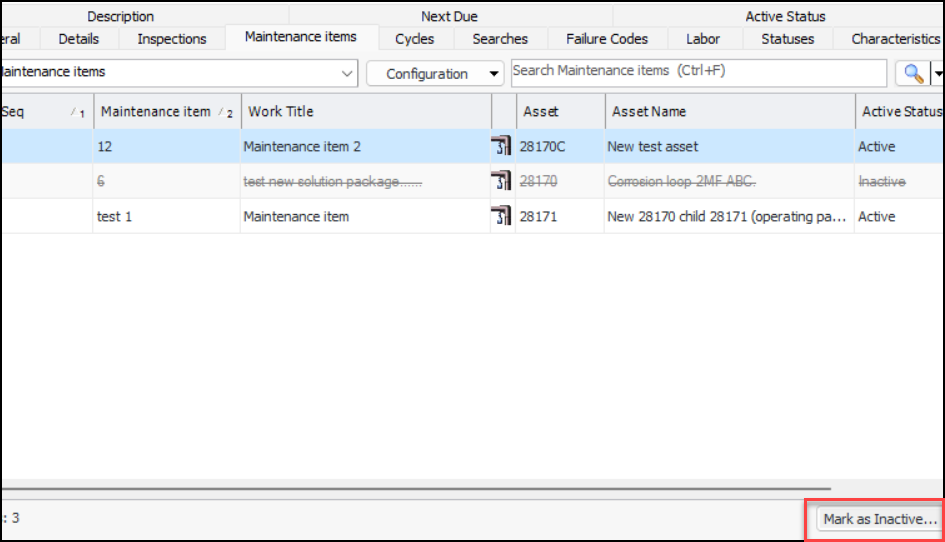
Open the solution package or template and select the tab for the subordinate level, in this example, Maintenance Items. Select an item in the table and click Mark as Inactive. You can provide a comment in the message box that appears. When you click OK, APM confirms that the item is inactive. The inactive package is shown as struck-through in the table. The Active Status column identifies the item as “Inactive”.When you are ready to reactivate the item, select it and click Mark as Active.AWEIS – Work Request and Scheduled Dates on Work Orders
Data Loaders
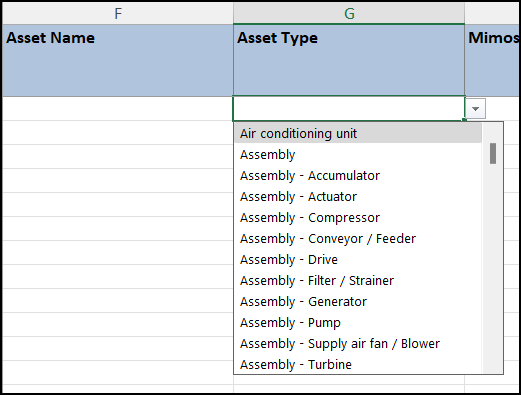
Pick Lists
In the Excel® workbook, place the cursor in the row below the column heading and click the drop-down list arrow:
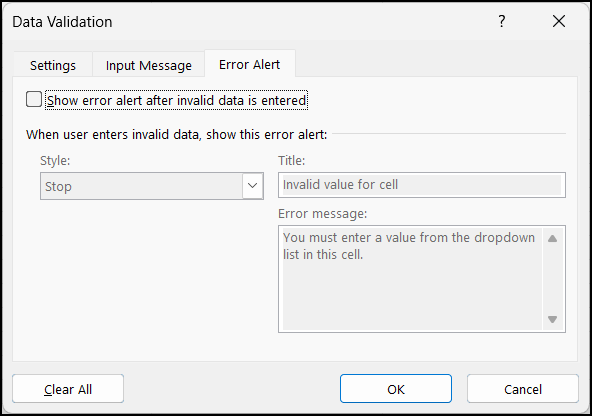
Entering Non-List Values
In the Excel workbook, select the cells in a column. Select Data in the ribbon and click Data Validation to open the Data Validation window. Select the Error Alert tab. Clear Show error alert after invalid data is entered.Click OK. You can now enter your own values or select values from the pick list.Standard Task Data Loader – New Properties
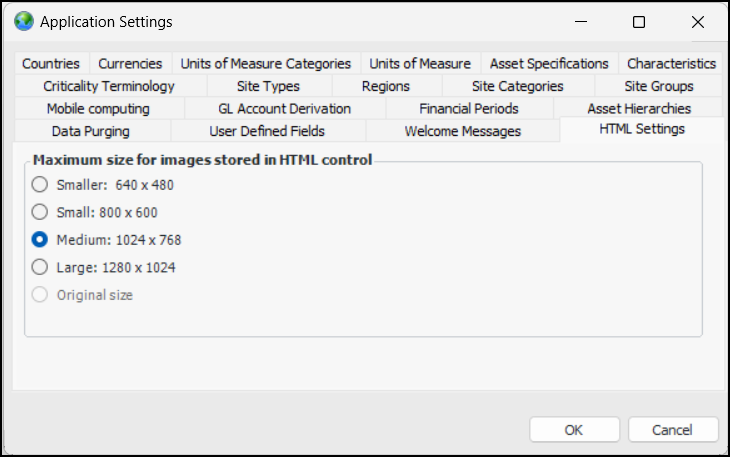
Image Size
In the Enterprise window, click the Administration menu and Application Settings. In the Application Settings window, select the HTML Settings tab:Indicators
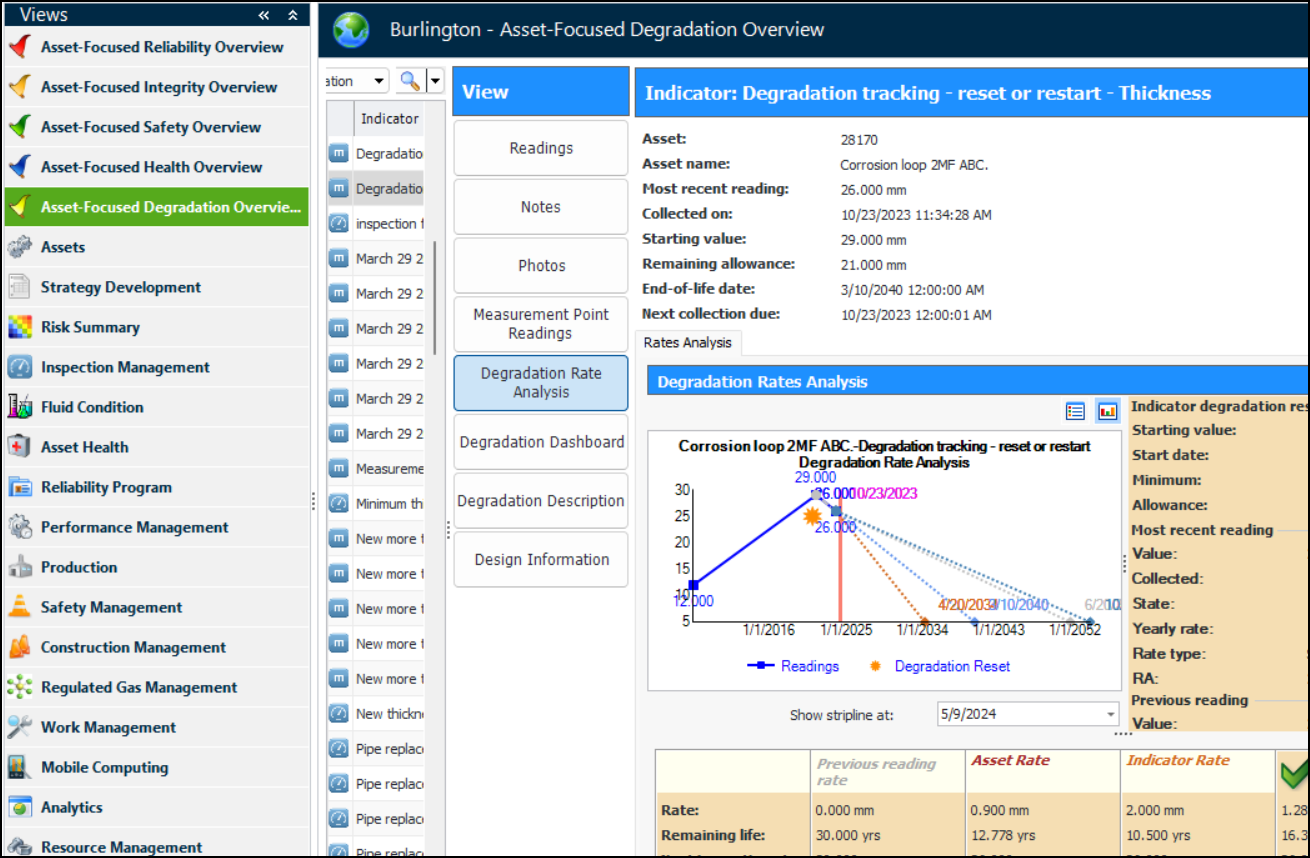
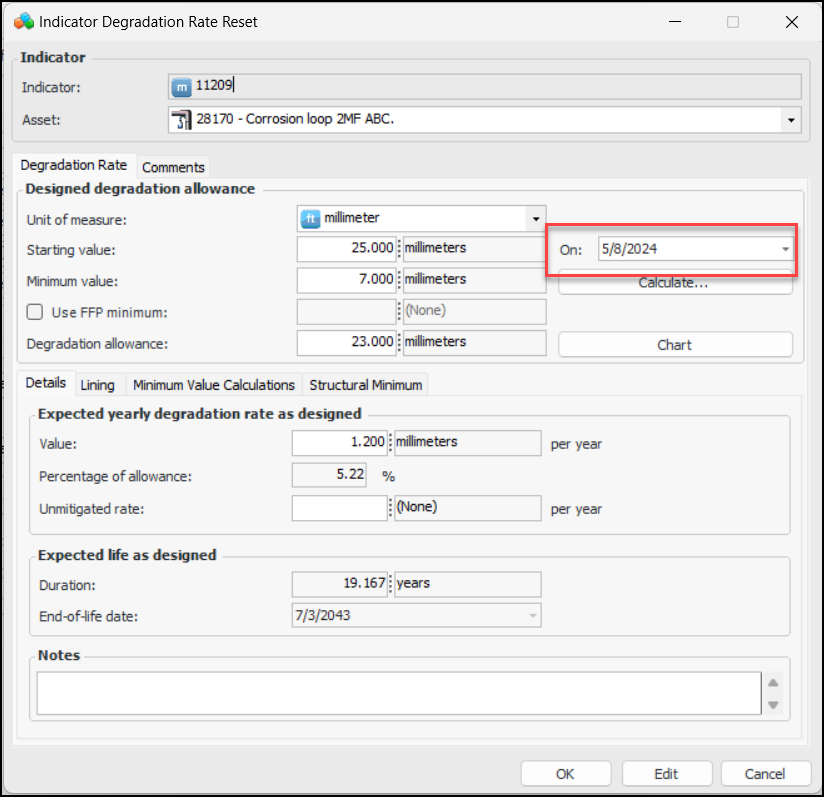
Resetting Indicators’ Degradation Rates
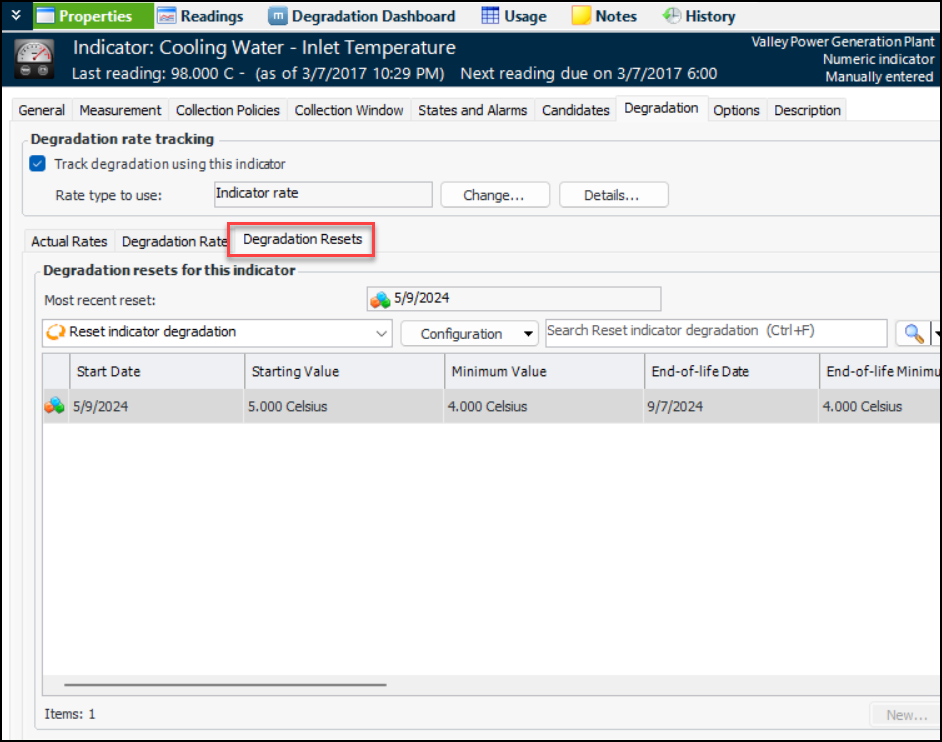
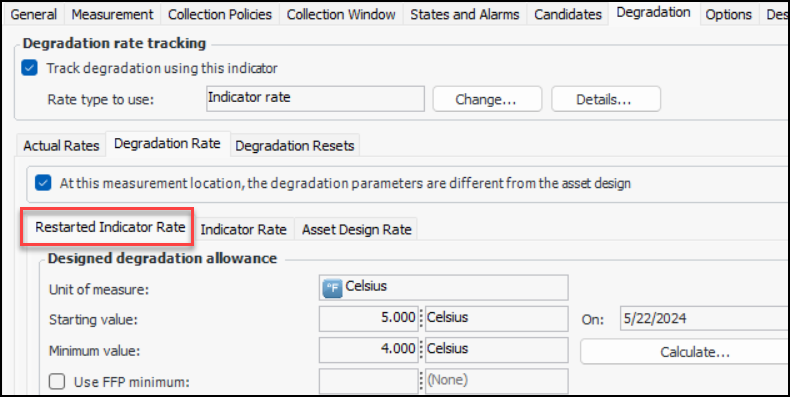
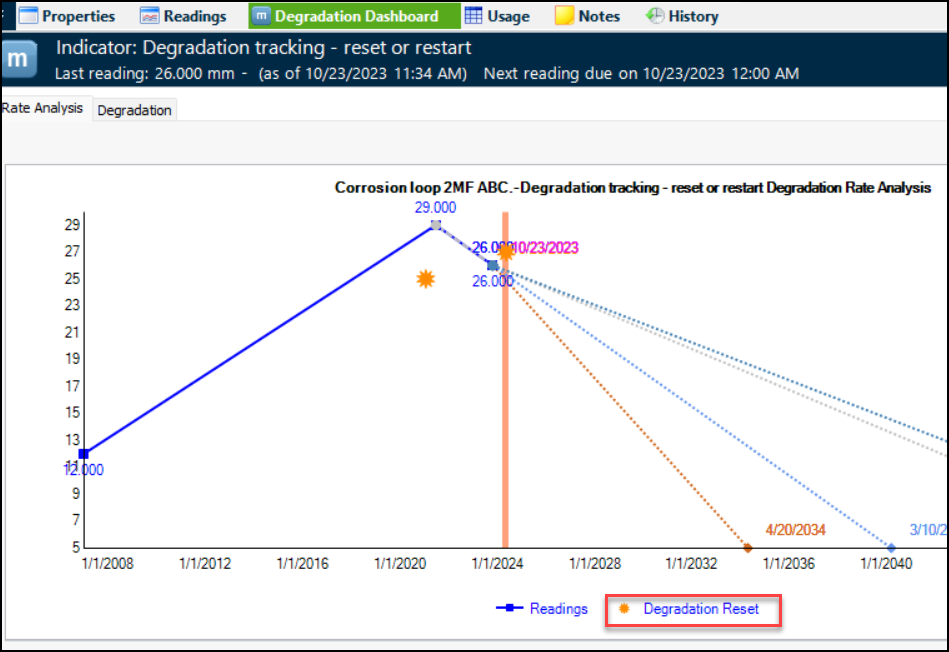
Note: The degradation reset function is available for technology preview. You must first enable feature 126 to use the functionality in APM. In the Enterprise window, select the Features view and the Enabled Features tab. Click Browse, select “Support ability to reset indicator degradation rate when piping replaced” and click OK. If APM is running as a smart client, click Refresh Enabled Features on the server. Then restart the client to use the functionality.To reset degradation tracking, open the Indicator window, click the Tools menu and then Reset Degradation. The Indicator Degradation Rate Reset window displays the current indicator degradation rate and the current date as the new starting date. For example:When the reset is saved, the Degradation Resets tab is added to the Indicator window. For example:In the Degradation Rate tab, you will find the Restarted Indicator Rate tab, as well as the Indicator Rate and Asset Design Rate tabs.Note: When an indicator has been reset, the Change Design Info button is no longer available. You can perform another reset to change design information.You can view resets at the site level by selecting the Inspection Management view, the Indicators tab, and the Degradation Resets tab.Indicator Measurement Points with Calculated States
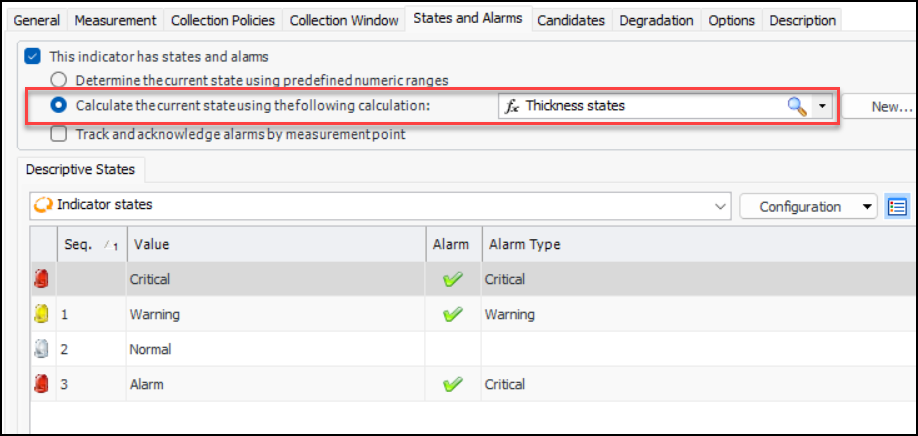
You can now assign calculations to indicator states when the indicator supports multiple measurement points. For example, a degradation indicator requires measurement points. On the States and Alarms tab, a calculation has been assigned to determine the states that will be applied to the aggregated readings:Note: Calculations are not supported when Track and acknowledge alarms by measurement point is selected. Measurement point readings must be aggregated to use calculations.Checksheet Original Planned Dates
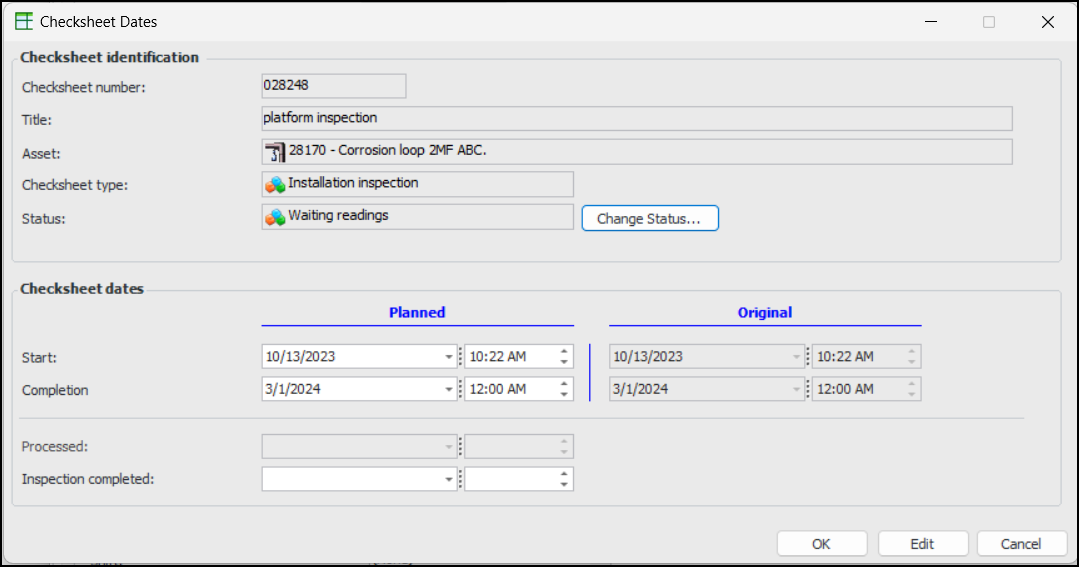
The original dates provide evidence of when the checksheet was initially required. To view these dates on the checksheet, select the General tab and clicknext to Planned start.
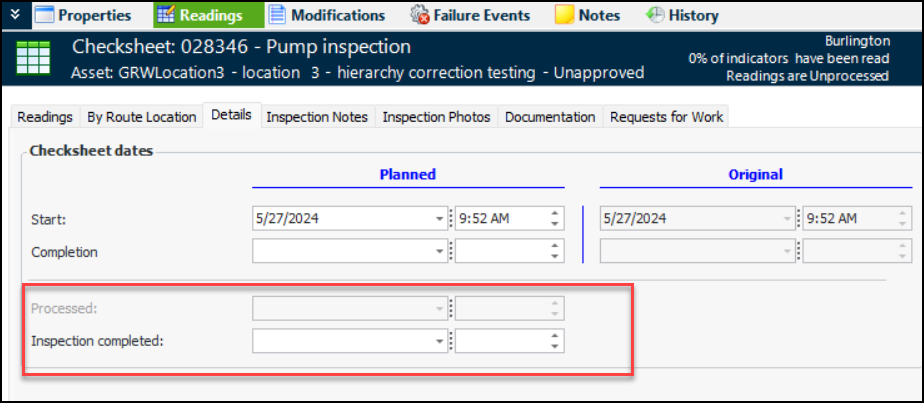
Checksheet Inspection Completion Date
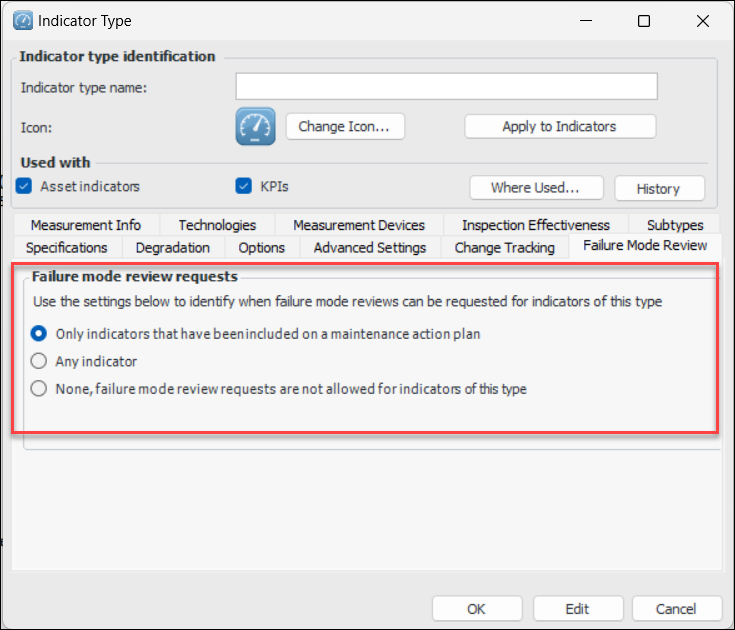
Request Failure Mode Review for Any Indicator
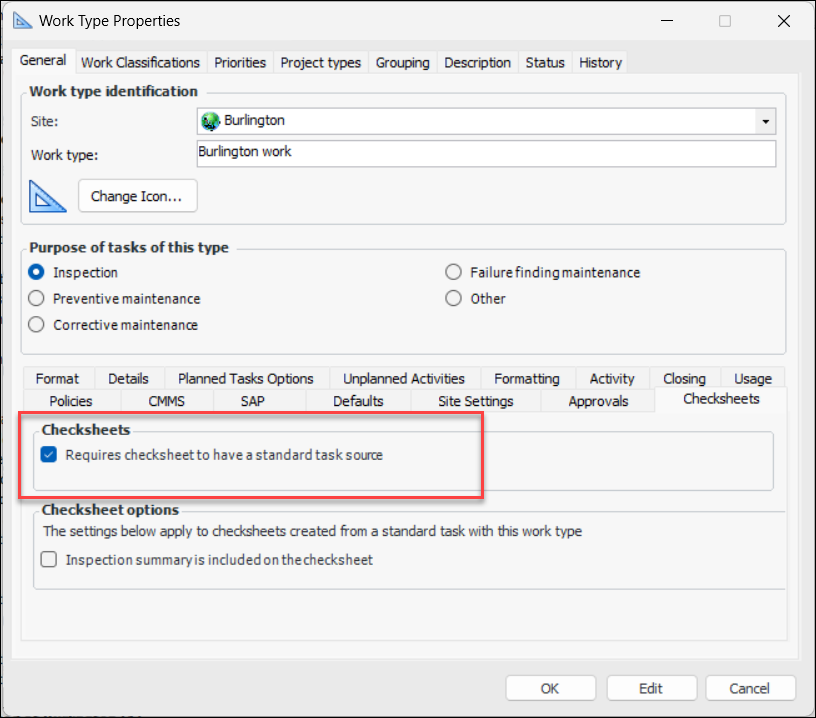
The indicator type controls this behavior. Select the new Failure Mode Review tab to set the options:Limit Work Types Available for Checksheets
Browsing for Asset Documents to add to a Checksheet
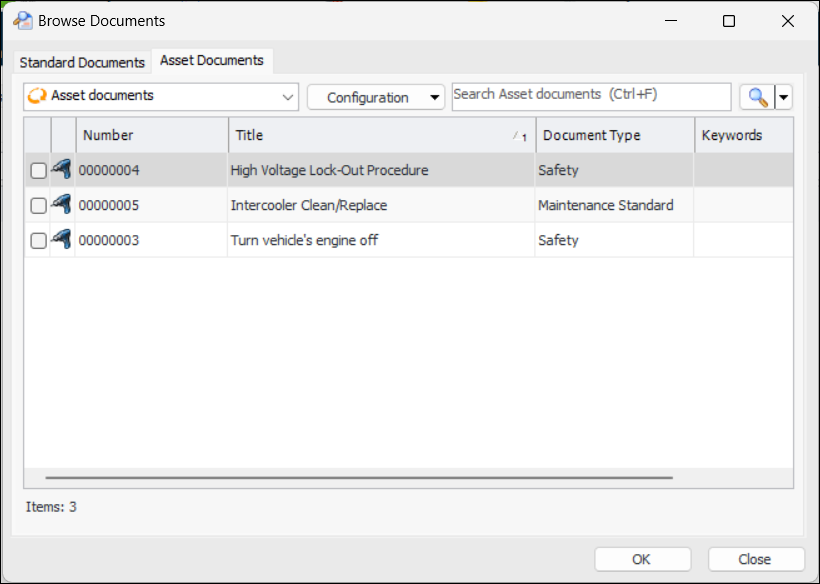
You can browse for documents to add to a checksheet by opening the Checksheet window, selecting the Readings view, selecting the Documentation tab, and then the Documents tab. Click Browse.The Browse Documents dialog now contains both the Standard Documents tab and the Asset Documents tab. This tab lists all of the documents assigned to the asset.Select one or more documents and click OK to add them to the checksheet.Indicator Reading Attachments Shown on Failures
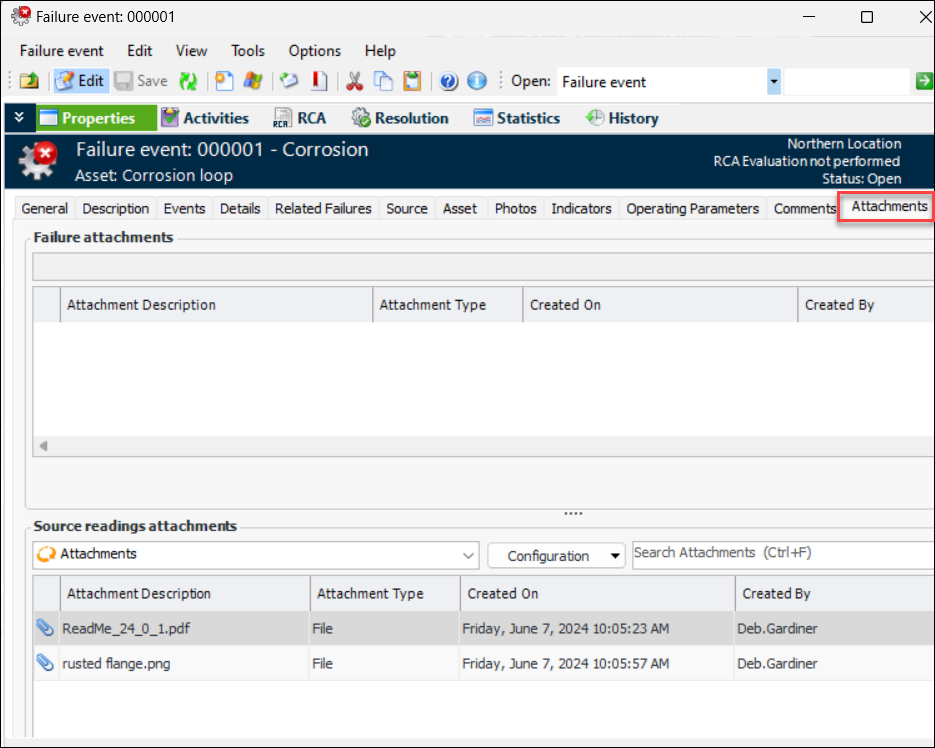
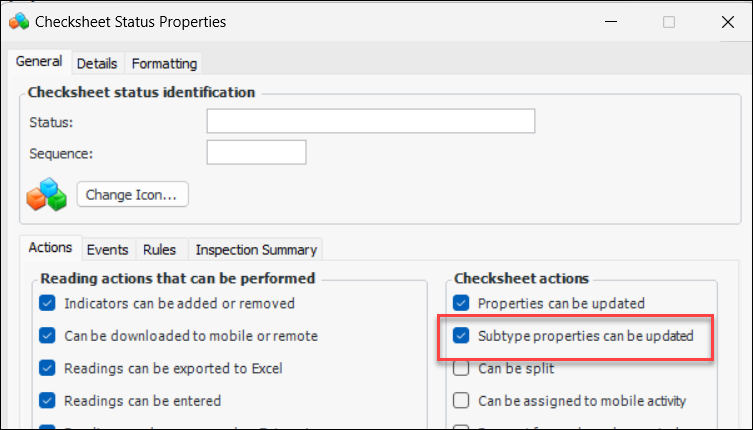
When an indicator alarm is acknowledged and a failure record created, you can now view the indicator reading’s attachments in the Failure Event window, Attachments tab. For example:Checksheet Status – Subtype Properties
Incorrect Readings
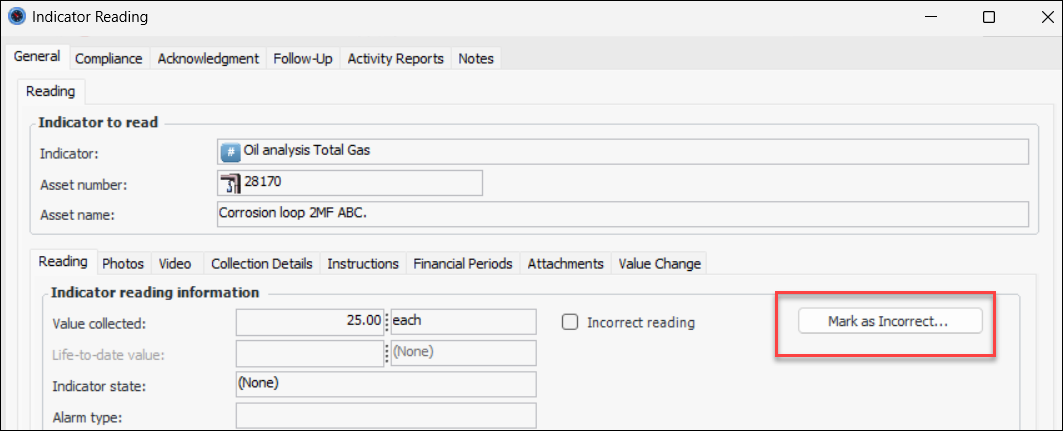
The Indicator Reading window now provides the Mark as Incorrect and Undo Mark as Incorrect buttons. This makes it easier to mark the reading as incorrect and to reverse the decision if needed.When you click Mark as Incorrect, a confirmation window appears where you can select a reason and provide comments. When you click OK, the window closes, Incorrect reading is selected, and the button label changes to Undo Mark as Incorrect.Online Data Collection (ODC)
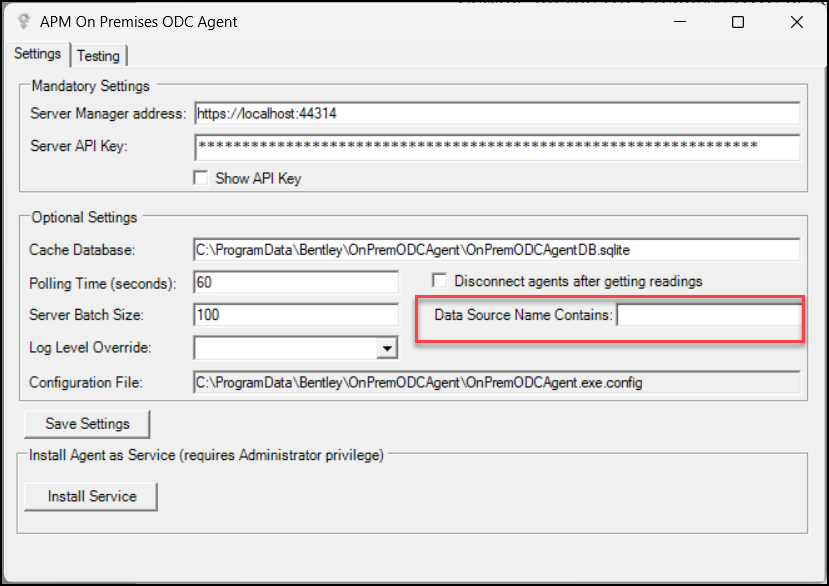
You can now configure the On-Premises ODC agent to use one or more specific data sources. On the APM On Premises ODC Agent dialog, use the Data Source Name Contains box to enter characters to filter data sources. For example, you could enter “DS” to select two or more data sources that contain those characters in their names.Product Usage
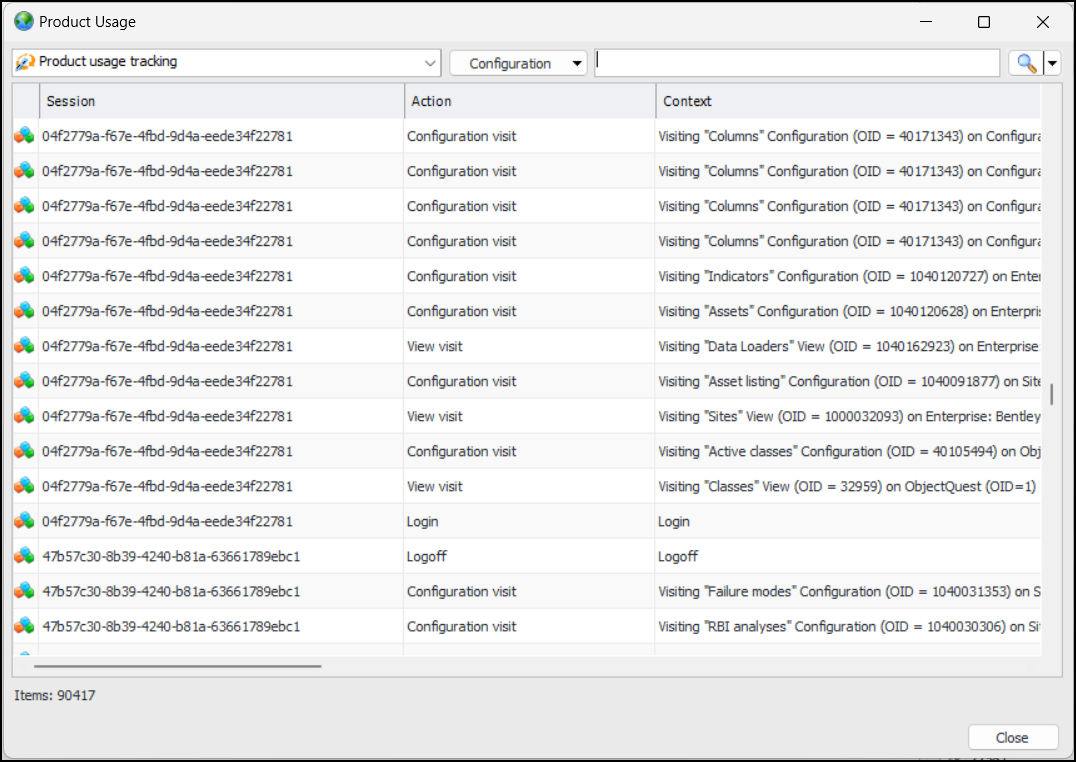
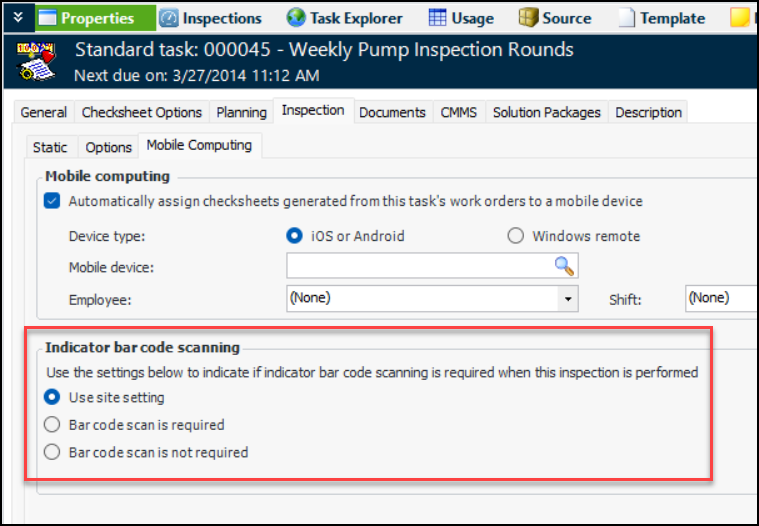
You can now view product usage tracking in APM. In the Enterprise window, click the Administration menu and then Product Usage. The Product Usage dialog appears. For example:Standard Tasks – Indicator Bar Code Scanning
You will find the options in the Standard Task window, Properties view, Inspection tab, Mobile Computing tab:
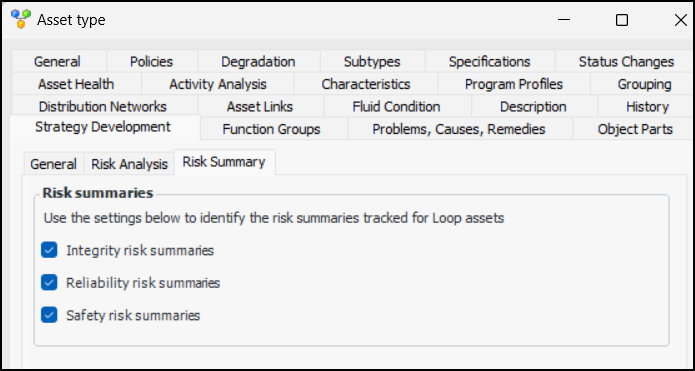
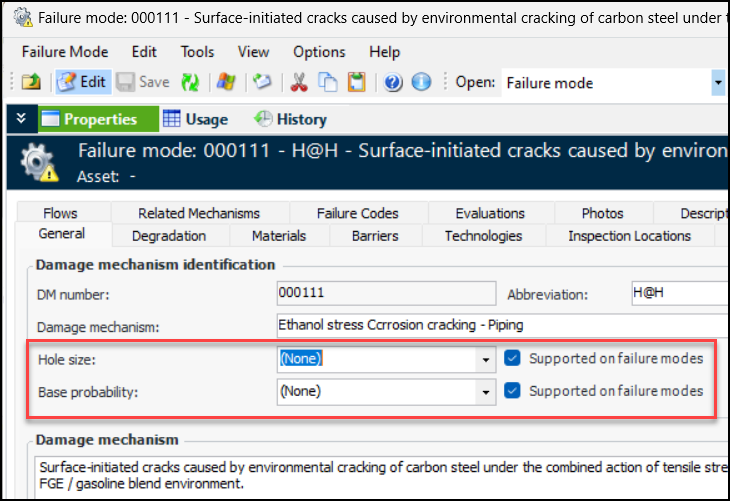
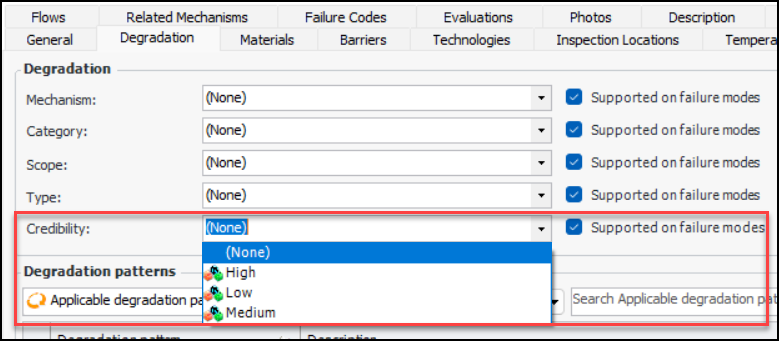
Strategy Development – Damage Mechanisms
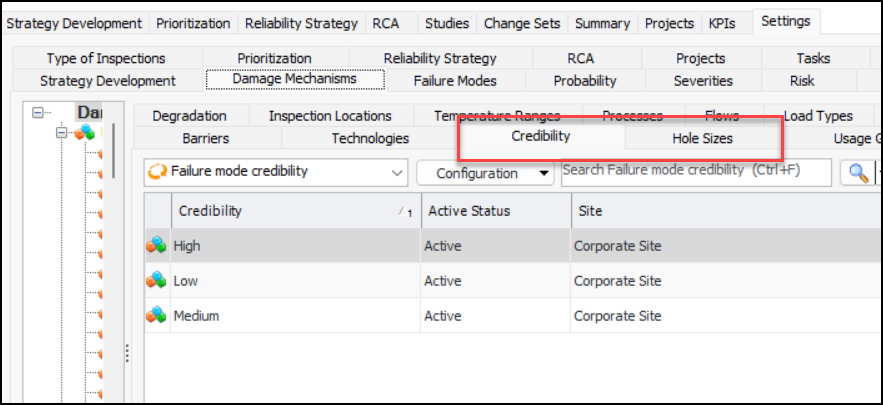
The following properties have been added to damage mechanisms: Hole size, Base probability, and Credibility. To access them, open the Site window, select the Strategy Development view, and the Damage Mechanisms Library tab. Open or create a damage mechanism. Select the Properties view, General tab:When Supported on failure modes is selected (default), the properties are copied to failure modes created from the mechanism.Select the Degradation tab to see the Credibility property:To populate the value lists for Hole size and Credibility, select the Settings tab in the site’s Strategy Development view. Select the Damage Mechanisms tab. The Credibility and Hole Sizes tabs allow you to create or edit values. For example: