|
|


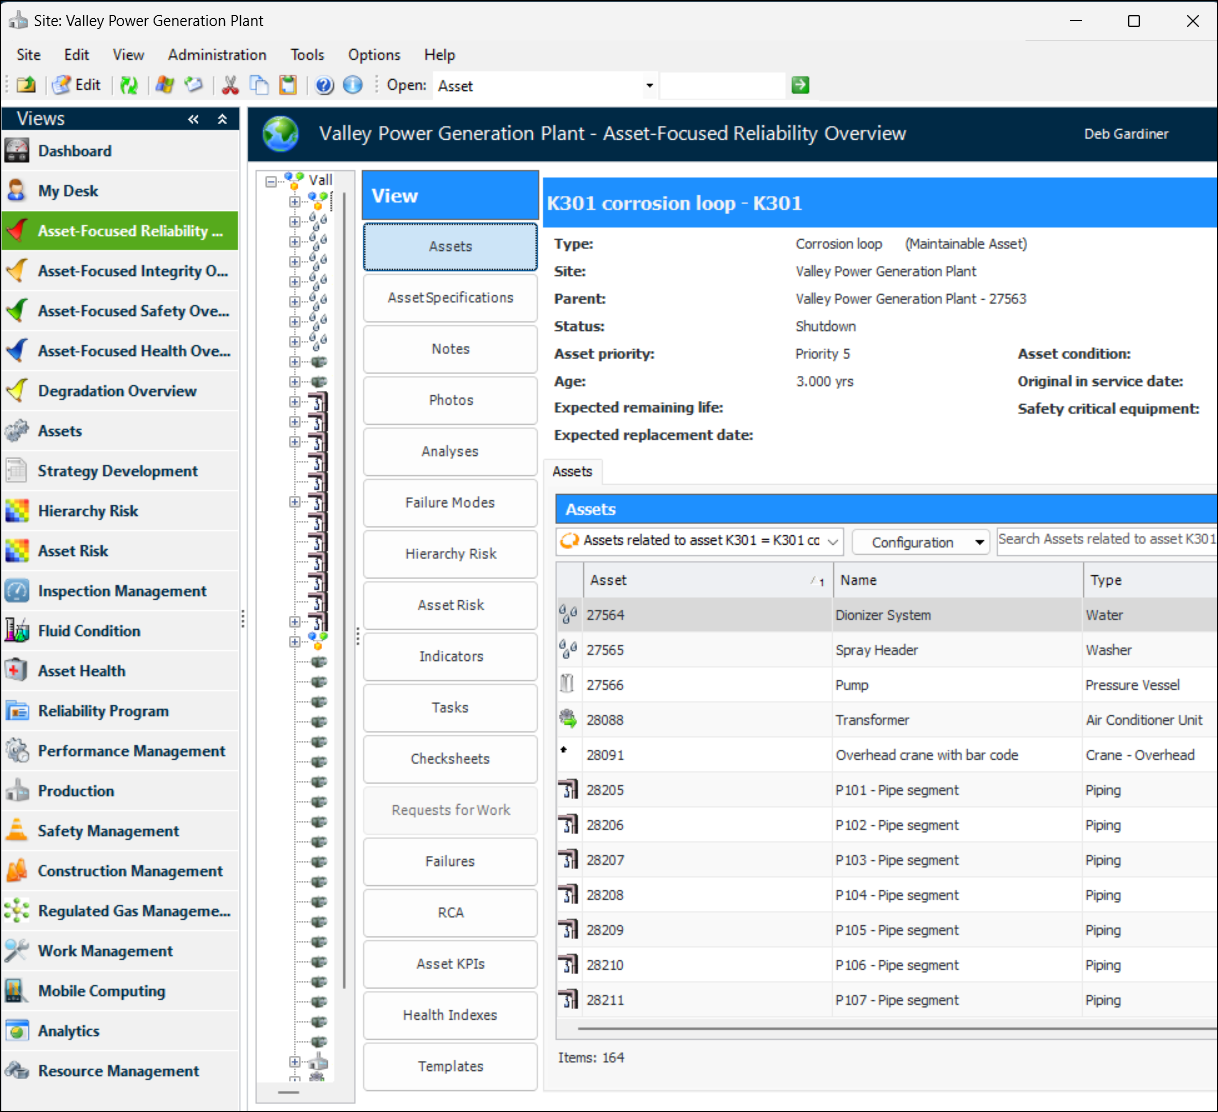
Viewing Asset-Focused Overviews
Tip: APM also provides summaries of risk evaluation data shown by asset and asset hierarchy. For more information, see Viewing Asset Risk Summaries.The Five Overviews
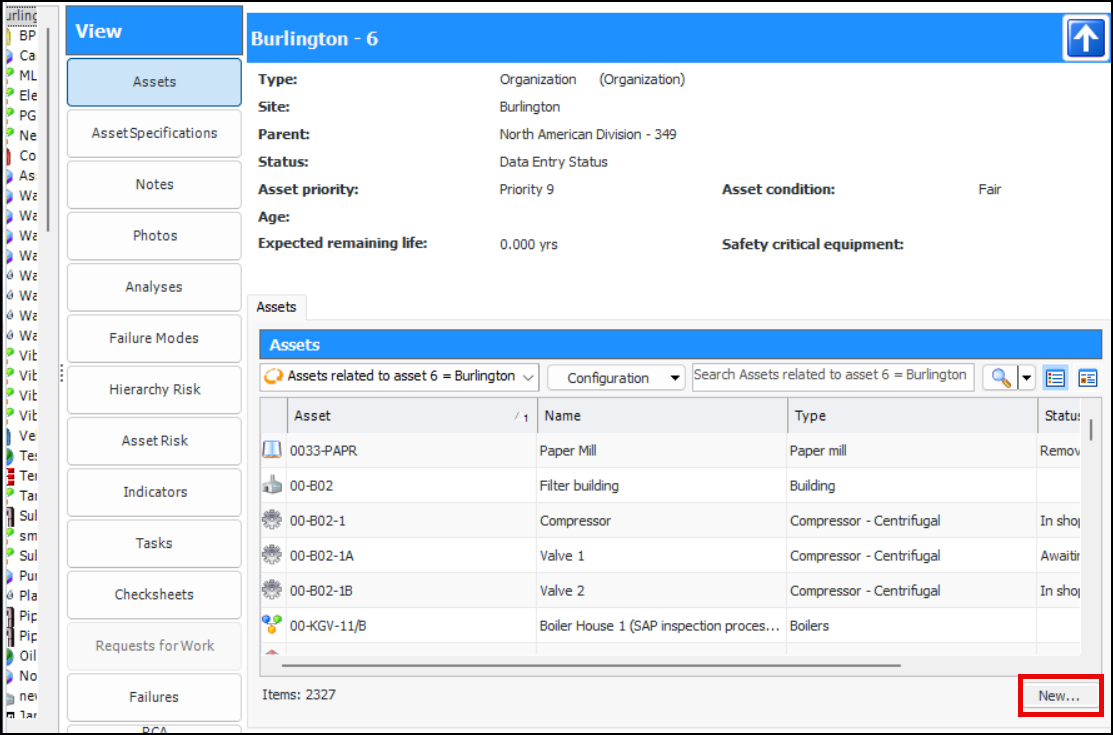
Adding New Objects
You can add a new object from several of the views in an overview. Look for the New button in lower right corner:Hierarchy Risk
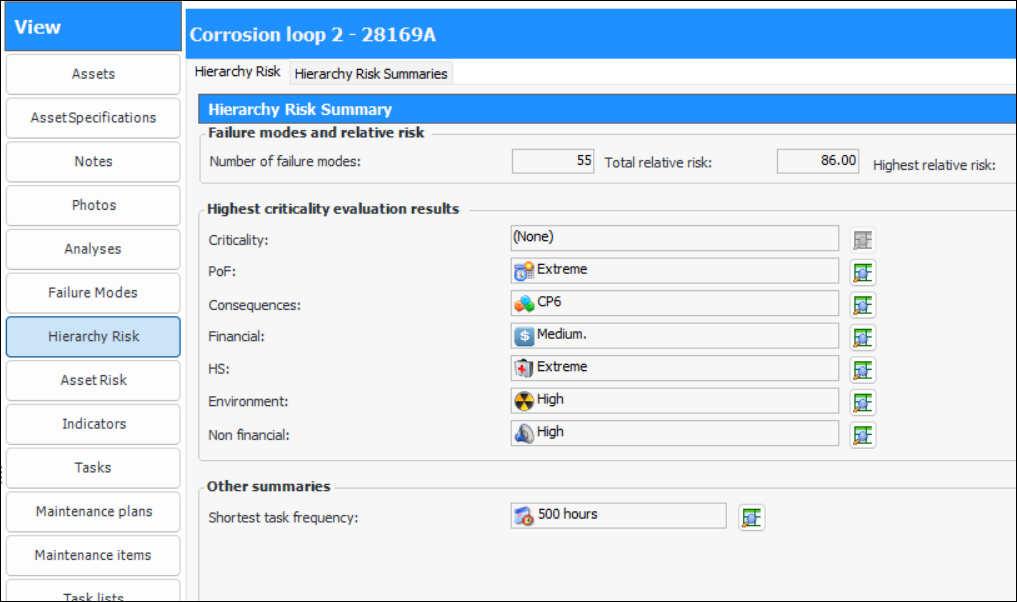
Select the Hierarchy Risk button to see a summary of the risk information for the selected asst and its descendants. For example:The Failure modes and relative risk area displays:
) to open a window listing the failure modes that have that value.
The Other summaries area displays the shortest task frequency on the summarized assets.Select the Hierarchy Risk Summaries tab to see a table that lists the selected asset and its related assets, as well as their risk summary values.Note: Asset hierarchy risk summaries are “generally available” product features. You must first enable features 121 and 137 to use the functionality in APM. In the Enterprise window, select the Features view and the Enabled Features tab. Click Browse, select “Asset risk summaries” and “Asset hierarchy risk summaries”, and click OK. If APM is running as a smart client, click Refresh Enabled Features on the server. Then restart the client to use the functionality.