|
|


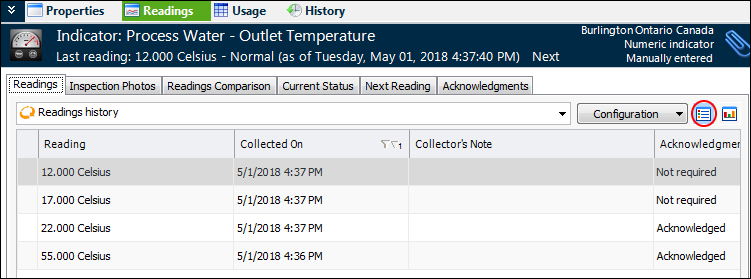
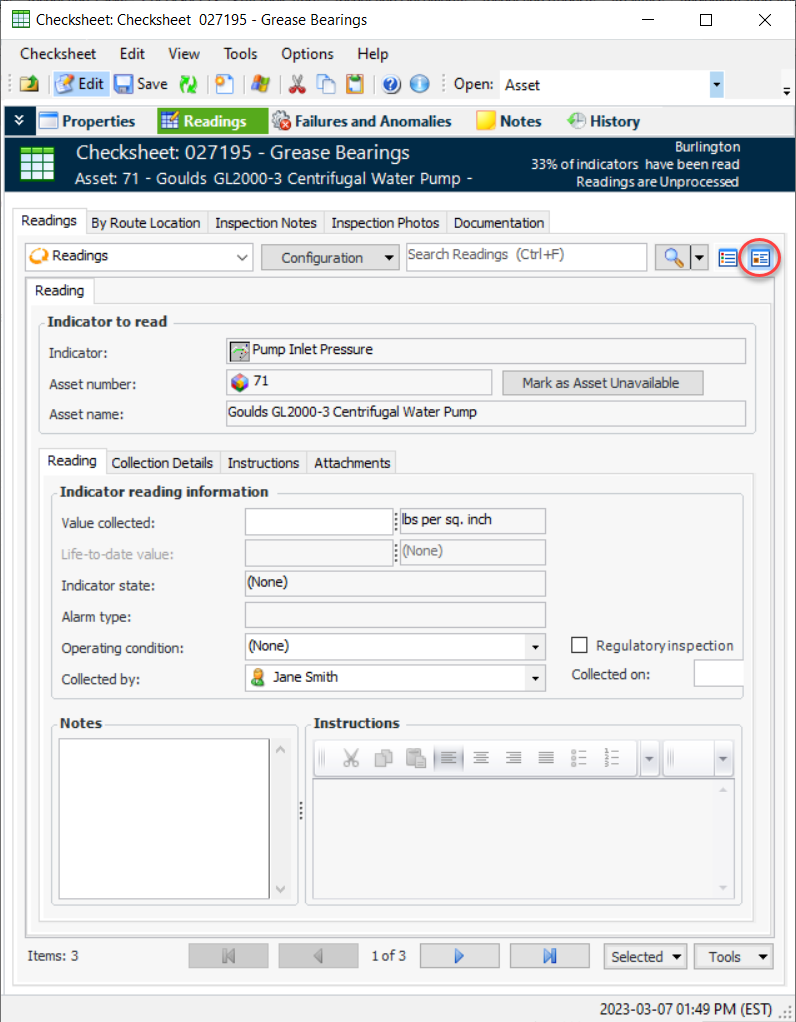
Viewing Information as a Table, Form, Chart, or Map
In APM, you can view objects such as assets, indicator readings, work order tasks, or failure modes in a table, chart, form, or map. Often, you can switch between viewing options by clicking an icon:
Viewing Table Configurations
A table configuration controls what information is listed in a table and how it is displayed. A table configuration is a combination of columns, filtering criteria, sorting criteria, and format choices that display specific data, such as all RCM2 analyses with a status of “New”.Viewing Forms
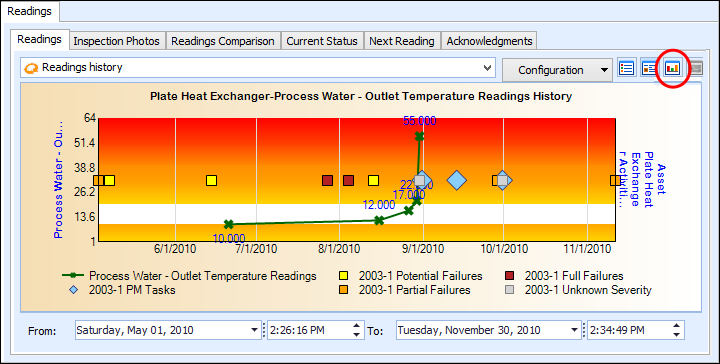
View as Chart
View data such as indicator readings in chart form. For example:View as Map