|
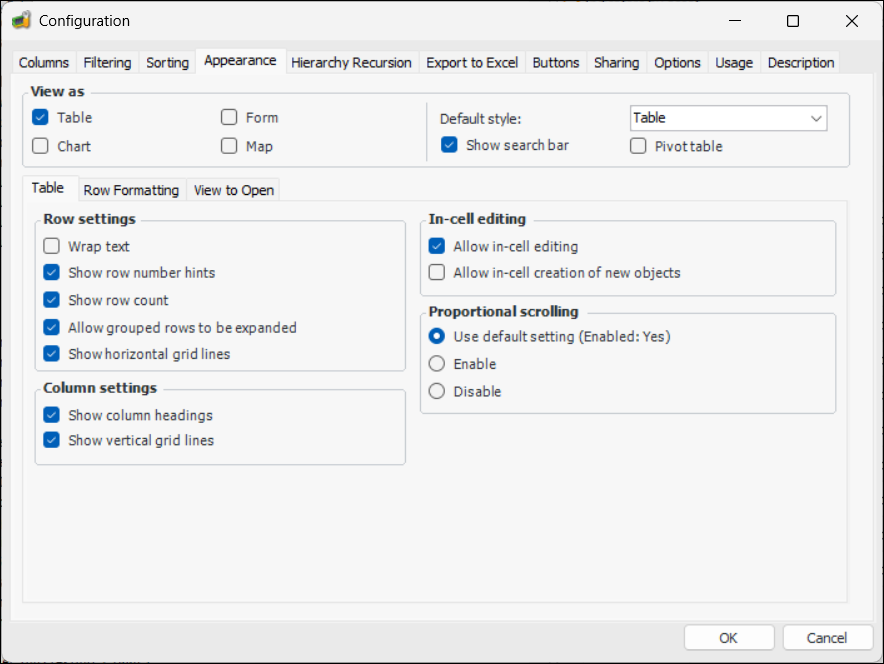
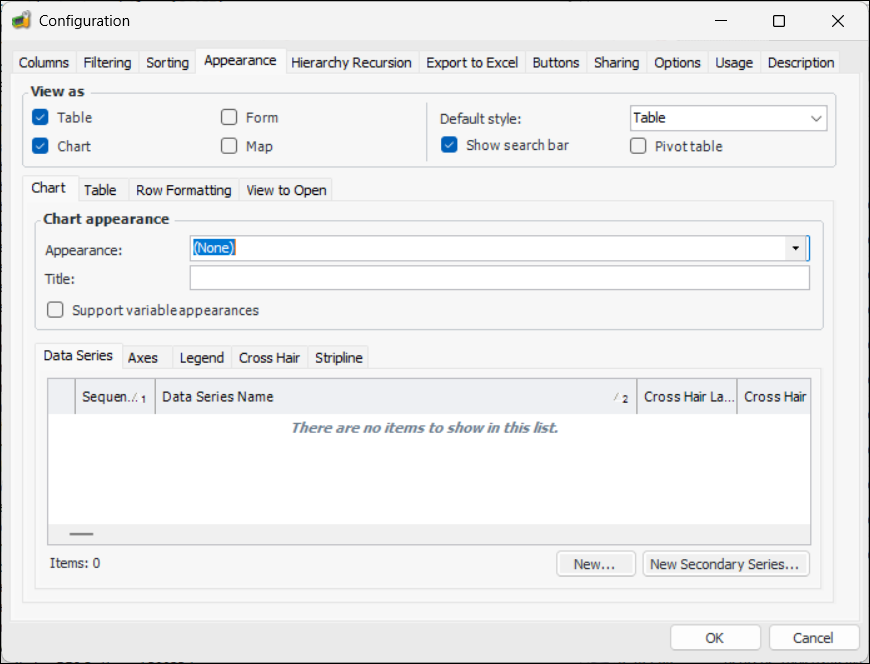
Defining View as Chart Appearance Properties
To Define View as Chart Appearance Properties
2.
3. Select the Appearance tab. For example:
4. In the View As area, select the appropriate options:
5.
6. Select the Chart tab and enter the following settings:
7. Select Support Variable Appearances to define multiple graph appearances for a chart. For more information, see Defining Variable Graph Appearances for a Chart.
8. Select the Data Series tab to define custom data series for the chart. For more information, see Defining Custom Data Series for a Chart and Defining a Secondary Data Series for a Chart.
9. Select the Axes tab to define X and Y axes and their properties. For more information, see Defining an Axis for a Chart.
10. Select the Legend tab to define a legend for the chart. For more information, see Creating a Legend for a Chart.
11. Select the Cross Hair tab to define cross hair settings for the chart. For more information, see Creating Cross Hair Settings for a Chart.
12. Select the Stripline tab to define the stripline properties for the chart. For more information, see Defining a Stripline for a Chart.
13. Click OK to save the formatting options.