|
|


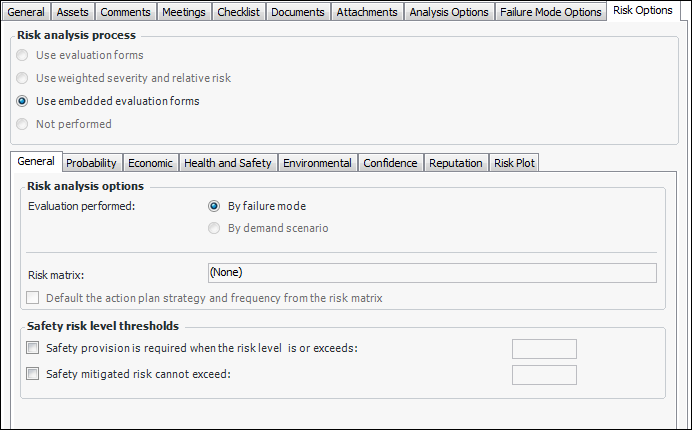
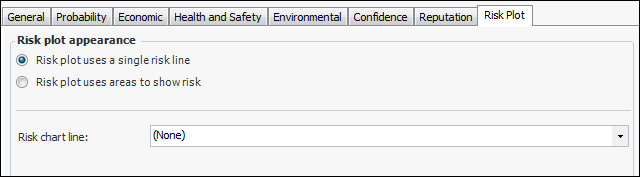
Setting Risk Analysis Options for a SIF Analysis
To Set Options for Using Embedded Evaluation Forms
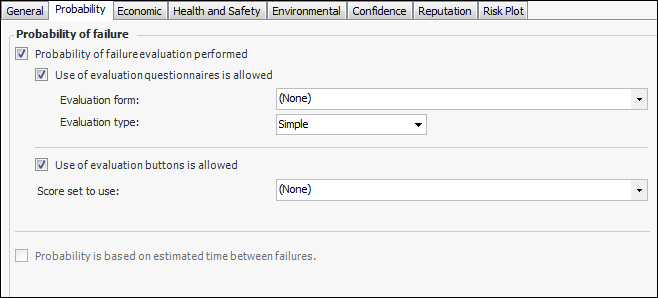
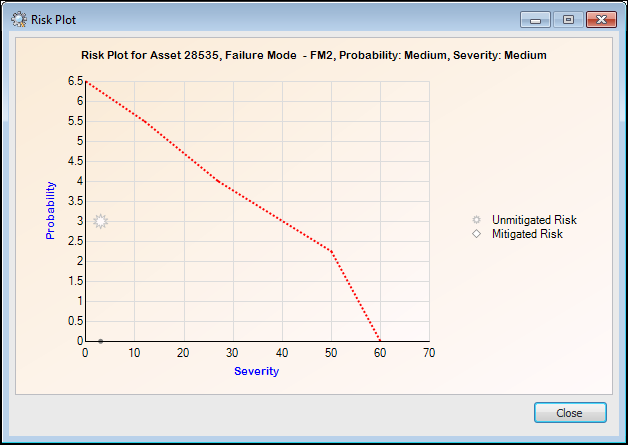
 is enabled.
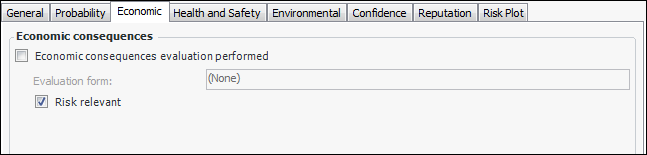
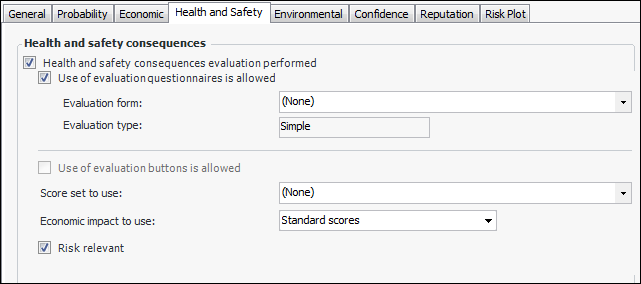
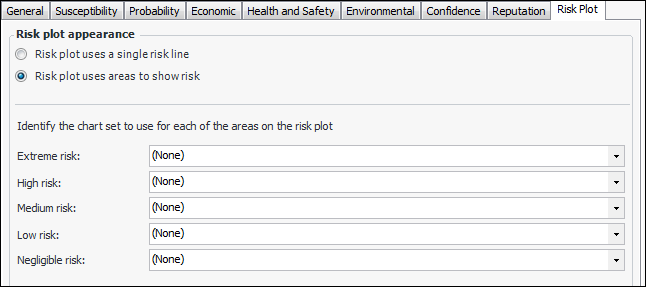