|
|


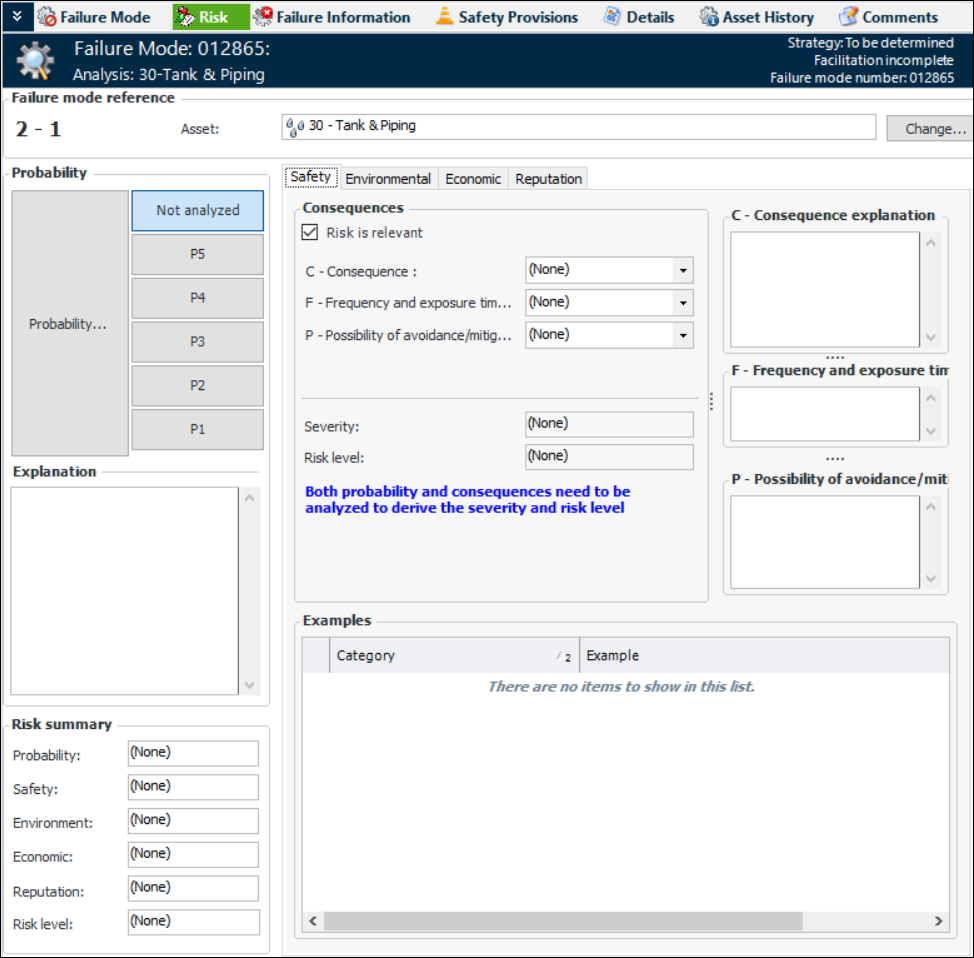
Performing SIF Failure Mode Risk Analysis
Note: Before you can perform risk analysis, the severities, probabilities, and risk matrix entries must be set up in the site’s risk analysis settings. If you are using evaluation forms, they must also be set up. For more information, see Risk Analysis Settings.
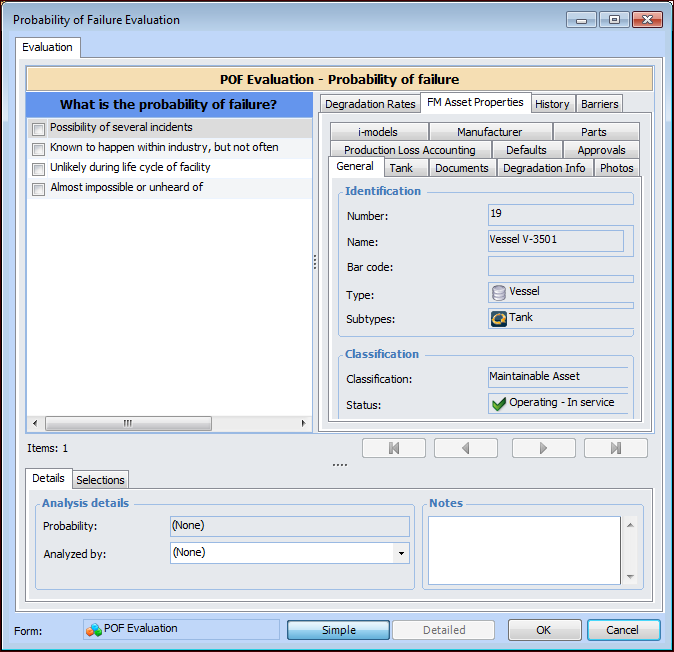
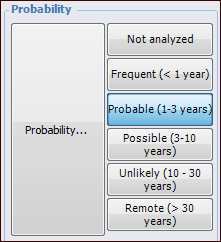
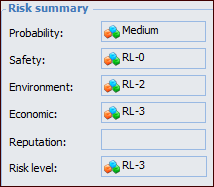
To Evaluate the Probability of Failure
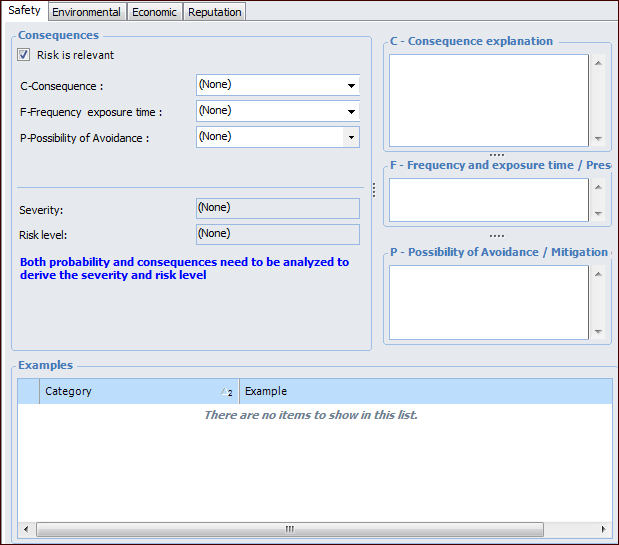
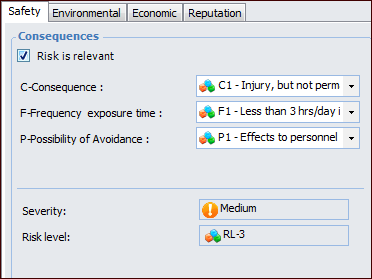
To Evaluate the Severity of Consequences
 is enabled.