|
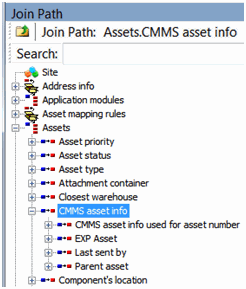
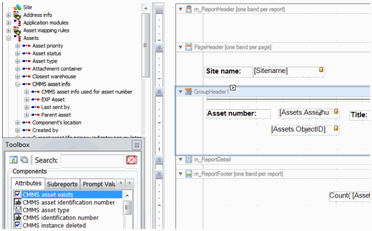
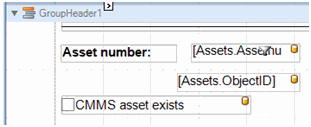
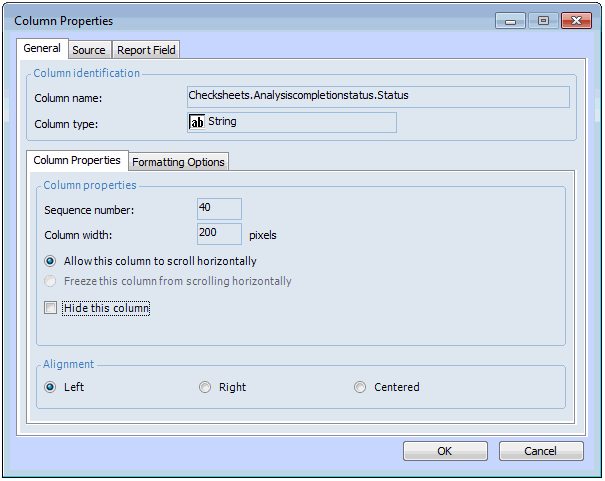
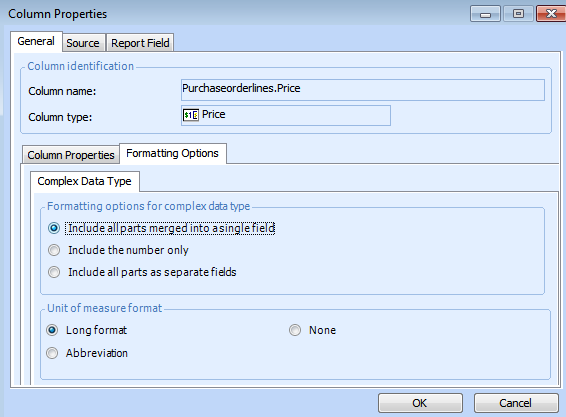
Adding Fields to a Report
To Add Fields to a Report
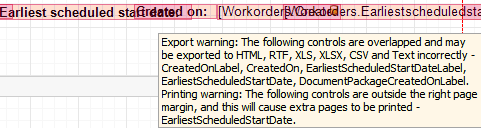
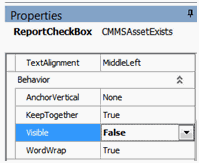
1. From the site menu bar, click Print and then Create Custom Report. In the New Report window, select Customize an existing report and then specify the report to customize (modify). Click OK to open a Report window.
3. To navigate to a related class, expand the hierarchy in the Join Path panel. Select the class in the hierarchy that owns the attribute that you want to add to the report.
4. To select an attribute from the class that owns the data group, select an option in the Join Path panel, expanding the join path hierarchy if necessary. For example, you can add CMMS information for an asset to the report.
5. The Toolbox panel, Attributes tab lists the attributes related to the join path. Click the attribute to add to the report and drag it onto the layout panel detail (or GroupHeader) band. For example, add the CMMS asset exists attribute to the report.
7. To hide the field in the body of the printed report, set the Properties panel, Behavior section, Visible option to False. You might want to do this if you are using a field only for filtering or sorting, or in the report’s header or footer.
8. If necessary, you can right-click the attribute in the layout panel to sort the list of items that appear on the report by selecting one of the following:
• Sort Ascending (a to z): Items with the lowest value or parameter will be listed first, at the top of the report.
• Sort Descending (z to a): Items with the highest value or parameter will be listed first, at the top of the report.
• Fixed: Enter the value or values that you want to use to filter the items on the report. It is not mandatory to enter data into the filter value fields, but for Fixed values it is recommended that you enter appropriate values. If you leave these fields blank, your report might contain no data, or have unexpected results.
• Run-time prompt: Select this option to enable end users to choose the filter values on the report’s Print dialog. Run-time prompts allow for very flexible filtering, because end users can determine what information they want to see. When you select this option, you can enter suggested values that can be changed when an end user runs the report
11. You can also define sort and filtering parameters for the report by setting the report configuration. From the menu bar, click the Configuration icon to open the Configuration dialog. For example:
12. To change the formatting options of complex data types, select the General tab, Formatting Options tab, then the Complex Data Type tab. For example:
• Include all parts merged into a single field: Both the value and unit of measure are displayed together in a single field.
• Include the number only: Only the value is displayed.
• Include all parts as separate fields: Only the value is displayed and the unit of measure is hidden. Note to display the unit of measure, add the “UnitOf_...” calculated field from the list of calculated expressions by dragging the label control from the accessory into the detail band of the report.
• Note: These options are available only for fields that are on the primary relationship of the report.Click OK to close the Configuration dialog.
• Avg: Select this option to list the average value in this field. The average is calculated by totaling all fields and dividing by the number of items in the list. Average only works when the field contains a Number, Date/Time, or Currency.
• Count: Select this option to get a count of the number of this field’s records in the report or group.
• Sum: Select this option to get a total value for all items in this field. Sum only works when the field contains a Number, Date/Time, or Currency.
• Running Sum: Select this option to get a current summary value for all items in this field, based on group, page or report. Running Sum only works when the field contains a Number, Date/Time, or Currency.
• Percentage: Select this option to obtain a percent ratio of the current field’s value to the total of all values.
• Min: Select this option to list the lowest value in this field. Minimum only works when the field contains a Number, Date/Time, or Currency.
• Max: Select this option to list the highest value in this field. Maximum only works when the field contains a Number, Date/Time, or Currency.
14. When you are finished, click OK to save the field.
Between: Use this condition to select a range of items to include on the report.Does not contain: If the attribute is a text string, use this condition to filter out strings that contain a specific string.Equal: Use this condition to include only the items that equal the parameter or value you enter. For example, you can select all work orders that have the status “Planned”.Greater Than: Use this condition to include only the items that are greater than the selected parameter or value.Greater Than or Equal: Use this condition to include only the items that are greater than or equal to the selected parameter or value.Less Than: Use this condition to include only the items that are less than the selected parameter or value.Less Than or Equal: Use this condition to include only the items that are less than or equal to the selected parameter or value.Like: If the attribute is a text string, use this condition to include items that contain a specific string. For example, if you enter a string with asterisks such as “*correct*”, you will get values that start or end with “correct”.Not Equal: Use this condition to include only the items that are not equal to the selected parameter or value.
• Fixed: Enter the value or values that you want to use to filter the items on the report. It is not mandatory to enter data into the filter value fields, but for Fixed values it is highly recommended that you enter appropriate values. If you leave these fields blank, your report may contain no data, or have unexpected results.
• Run-time prompt: Select this option to enable end users to choose the filter values on the report’s Print dialog. Run-time prompts allow for very flexible filtering, because end users can determine what information they want to see. When you select this option, you can enter suggested values that can be changed when an end user runs the report.
Ascending: Items with the lowest value or parameter will be listed first, at the top of the report.Descending: Items with the highest value or parameter will be listed first, at the top of the report.
15. To perform a calculation using the data in the field, select the Aggregation tab. Select the type of calculation to perform:
None: Select this option if you do not want any calculations performed on the information in this field.Sum: Select this option to get a total value for all items in this field. Sum only works when the field contains a Number, Date/Time, or Currency.Maximum: Select this option to list the highest value in this field. Maximum only works when the field contains a Number, Date/Time, or Currency.Minimum: Select this option to list the lowest value in this field. Minimum only works when the field contains a Number, Date/Time, or Currency.Average: Select this option to list the average value in this field. The average is calculated by totaling all fields and dividing by the number of items in the list. Average only works when the field contains a Number, Date/Time, or Currency.Count: Select this option to view the number of items in this field. Count works for any field on your report.
16. When you are finished, click OK to save the field.