|
|


Overview of Failure Mode Risk Analysis
After you have analyzed the failure modes, you can compare failure modes and identify the relative importance of addressing them. The Risk Assessment view in the Strategy Development Analysis window includes failure mode lists based on criticality, consequence priority, severity, and relative risk, as well as a risk plot, risk matrix, and lists of the evaluations. This view is also available for the asset.Before you can perform risk analysis, the probabilities, severities, evaluation forms, consequence priorities, confidence factors, and risk matrix entries must be set up in the site’s Strategy Development settings. For more information, see Risk Analysis Settings.Risk (Criticality)
Severity
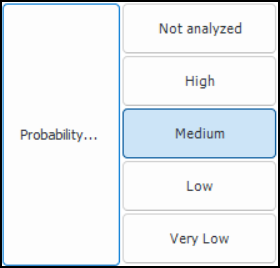
Probability of Failure
Detectability
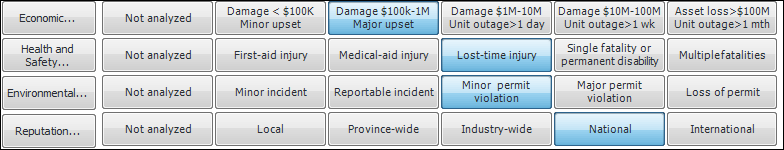
Consequences
Economic Consequences
Health and Safety Consequences
Environmental Consequences
Reputation Consequences
Failure Mode Consequence Priorities
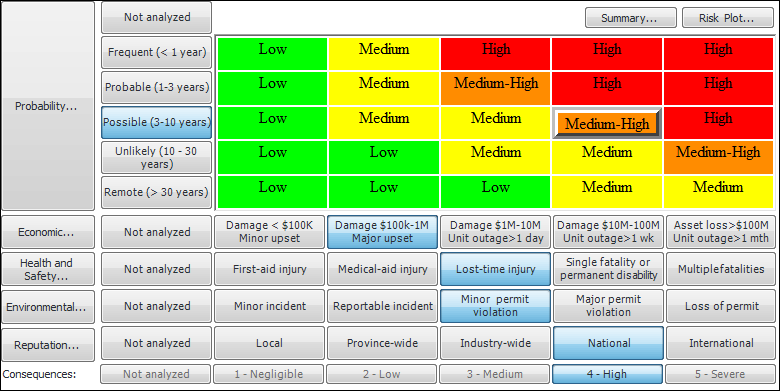
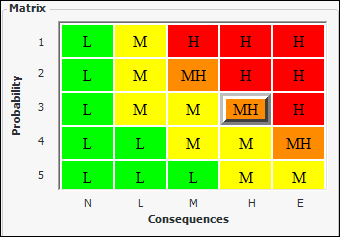
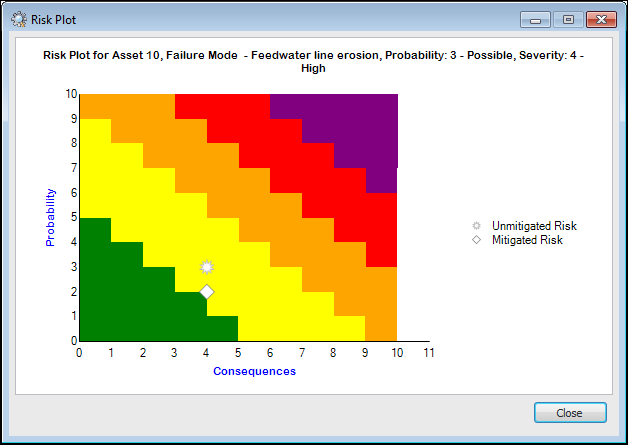
Risk Matrix
Probability of Failure
Consequence Categories
Consequences
Criticality Rating
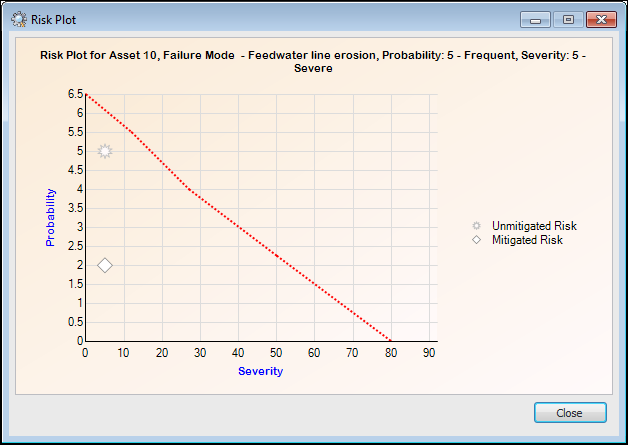
Risk Plot Chart