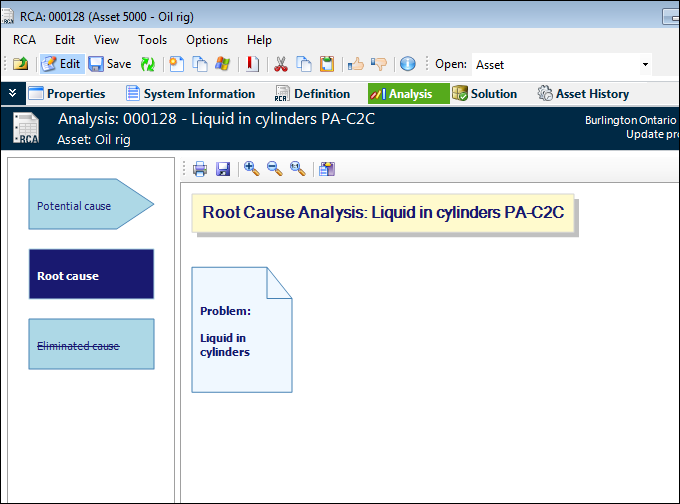
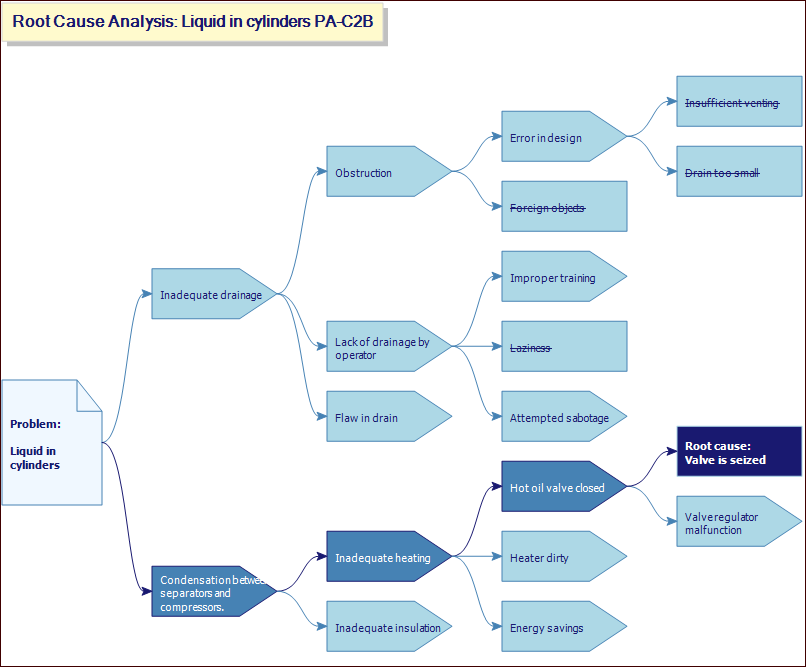
Performing a Root Cause Analysis

When you have created an RCA record and defined the problem, it is time to record the analysis that identifies contributing and root causes. As the analysis team describes and verifies causes, you can add them to the RCA diagram along with supporting information. The objective of using the RCA diagram is to understand and analyze the causes that can lead to the problem and then to determine which one (or more) of them is the original cause.
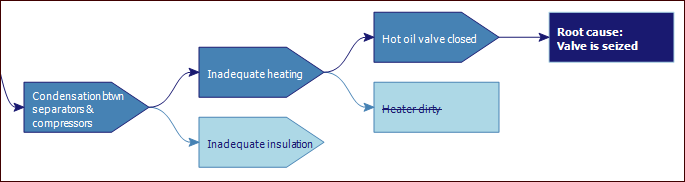
If your organization requires that root cause analyses be sent for approval, this step typically occurs before solutions are implemented. For information, see Sending an RCA for Approval.
When you have identified a root cause, you can define its solution in the form of either a strategy development analysis or a request for an analysis. For information, see Creating Solutions for Root Causes.
Note: The colors, shapes, text, and behavior available in the diagram are determined by the diagram template selected in RCA settings. You can choose from four templates provided by APM. An administrator can also copy one of the supplied templates and customize it for your needs.
This topic explains the RCA diagram and how to use it to record the root cause analysis.

RCA Diagram

The RCA diagram is a horizontal tree structure that shows the relationships between the problem and its potential, contributing, eliminated, and root causes. Here is an example:
Each element in the analysis is represented as follows:
When you place an element in the diagram, APM automatically adds lines and arrows to show the relationships between the problem and its causes.

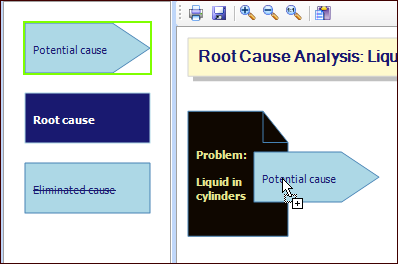
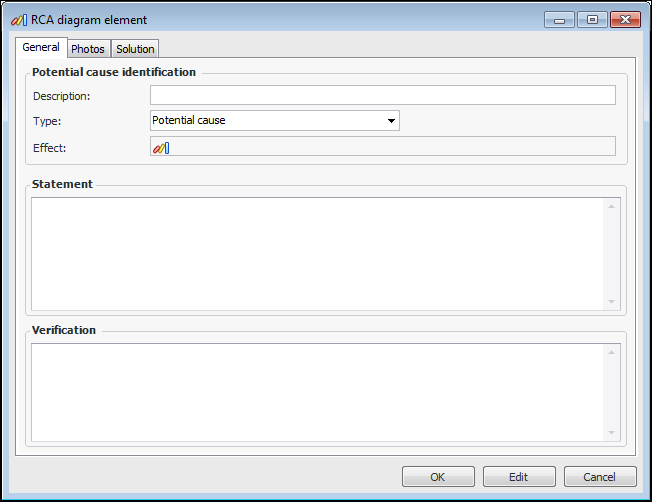
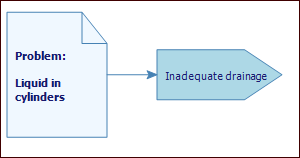
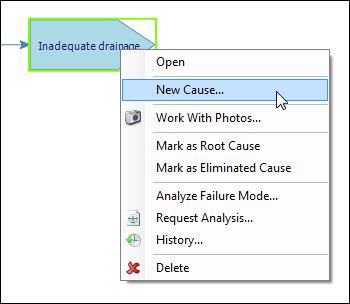
To Use the RCA Diagram

1.
2.
The analysis title is displayed at the top of the diagram.
3.
The Problem element displays the description from the Definition view, Problem tab. To change the problem definition, double-click the element. The RCA Diagram Element dialog appears, where you can edit the value in the Description box. The Statement box displays the problem statement that was entered in the Definition view. You can edit the statement here.
4.
Tip: Or you can right-click the problem element and click New Cause.
The RCA Diagram Element dialog appears:
5.
Provide a brief description in the Description box. Use the Statement box to record a detailed description of the cause and its effects.
6.
Use the Verification box to describe how the cause was identified, for example, using technologies or expertise such as vibration analysis, metallurgic review, or fracture analysis.
7.
Select the Photos tab if you wish to browse for a photograph to attach to the element.
8.
Click OK to close the dialog. The cause is added to the diagram:
9.
Right-click an element and click Work with Photos. The Photos dialog appears, where you can view photographs attached to the element or browse for new ones.
10.
11.
Identify a root cause by either dragging the shape to a parent element or right-clicking the element and clicking Mark as Root Cause. The element and its contributing causes change appearance accordingly. For example:
Tip: You can change an eliminated or root cause to another status by right-clicking it and clicking the appropriate status.
12.
To see the history of an element, right-click it and click History. The History dialog shows the actions performed, old and new values, and so on. For example:
13.