|
|


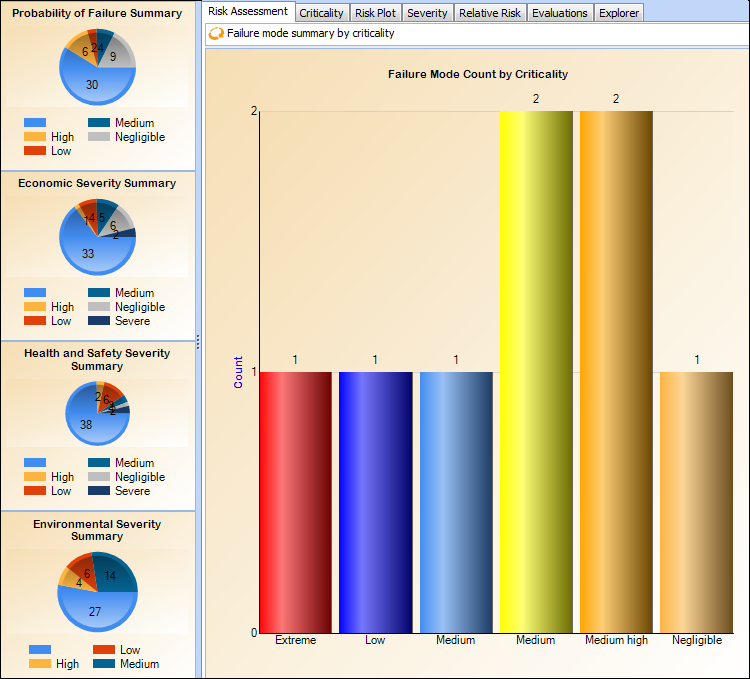
Viewing Risk Analyses for RBI Failure Modes
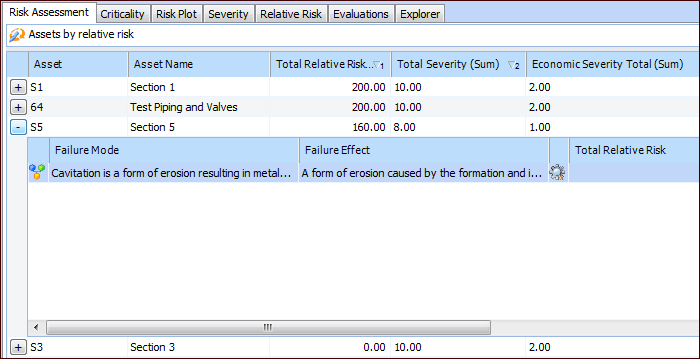
After you have analyzed the failure modes in an analysis, you can compare failure modes and identify the relative importance of addressing them. The Risk Assessment view in the Strategy Development Analysis window includes charts based on severity and relative risk, a risk plot, risk matrix, and summaries. This view is also available for the asset.Tip: You can also view risk assessments and risk matrix information for all failure modes on the site. On the Site window, select the Strategy Development view and tab, and then the Risk Assessment tab. To view an asset’s information, open the Asset window, and select the Risk Assessment view.The following example shows an analysis’ Risk Assessment view with the “Failure mode summary by criticality” configuration selected.Tip: The probability and severity charts shown in this example are set up as sidebar dashboards and assigned to employees. For more information, see Dashboards.The tabs on the Risk Assessment view provide the following information.Risk Assessment
Criticality
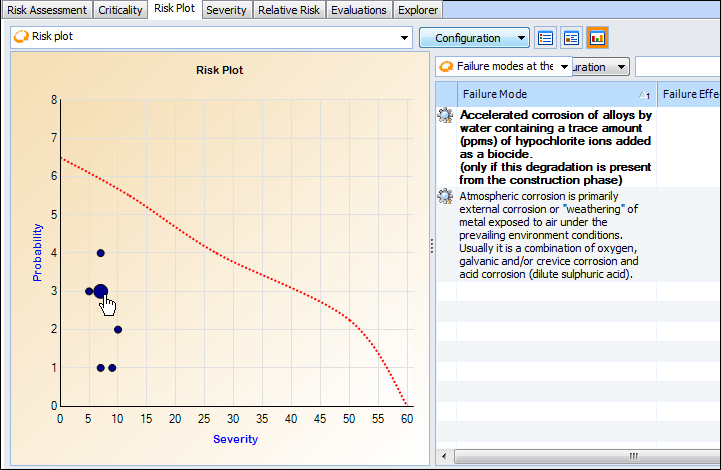
Risk Plot
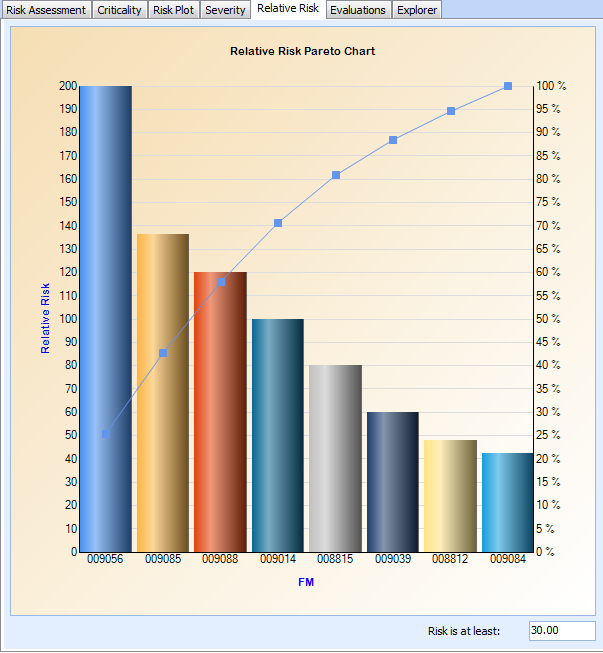
Severity and Relative Risk
These tabs display Pareto charts for the values. Here is an example of the Relative Risk tab:Evaluations
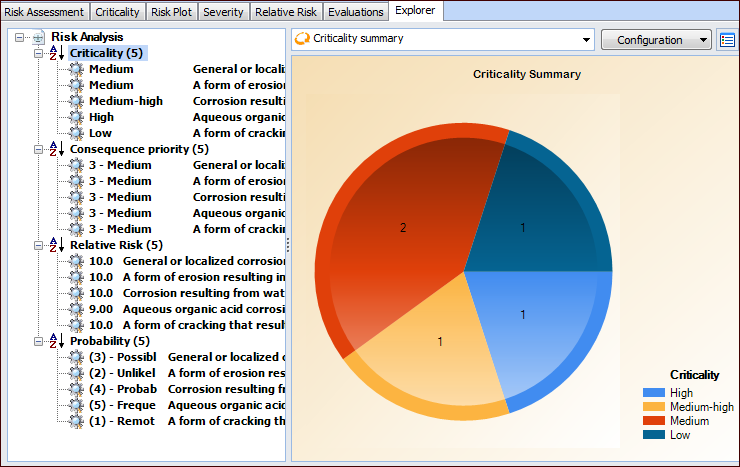
This tab shows lists of failure modes for which probability, economic, health and safety, environmental, and/or reputation evaluations have been performed. Select the Evaluation Audit tab to view lists of failure modes for which evaluations have not been performed.Explorer