|
|


RBI Calculations
Failure Mode Criticality
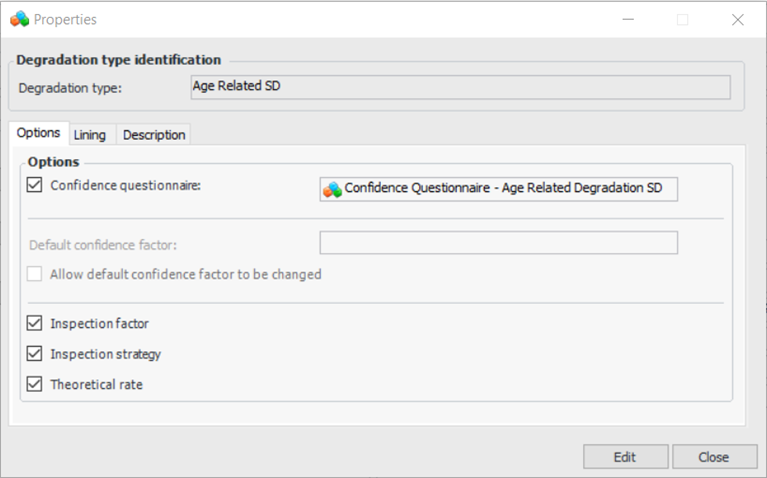
Degradation Type
Damage Mechanism
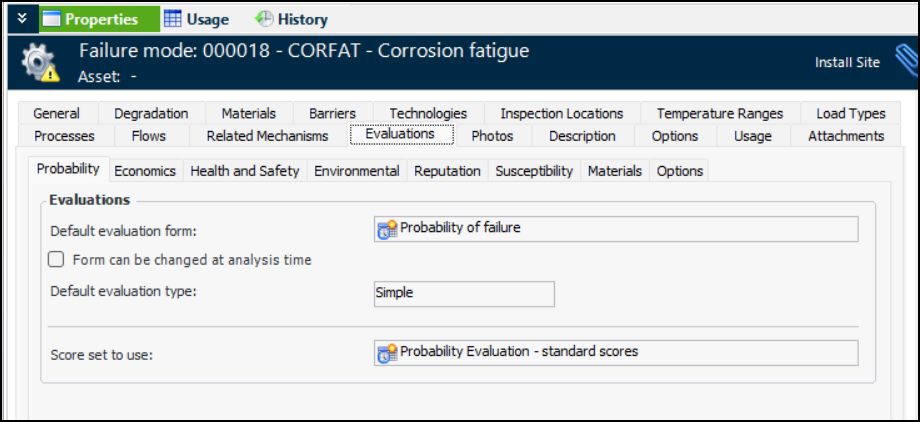
Here is an example of a Corrosion Fatigue damage mechanism. The Evaluations tab shows the forms and score sets for evaluations:Defaulted Questionnaires
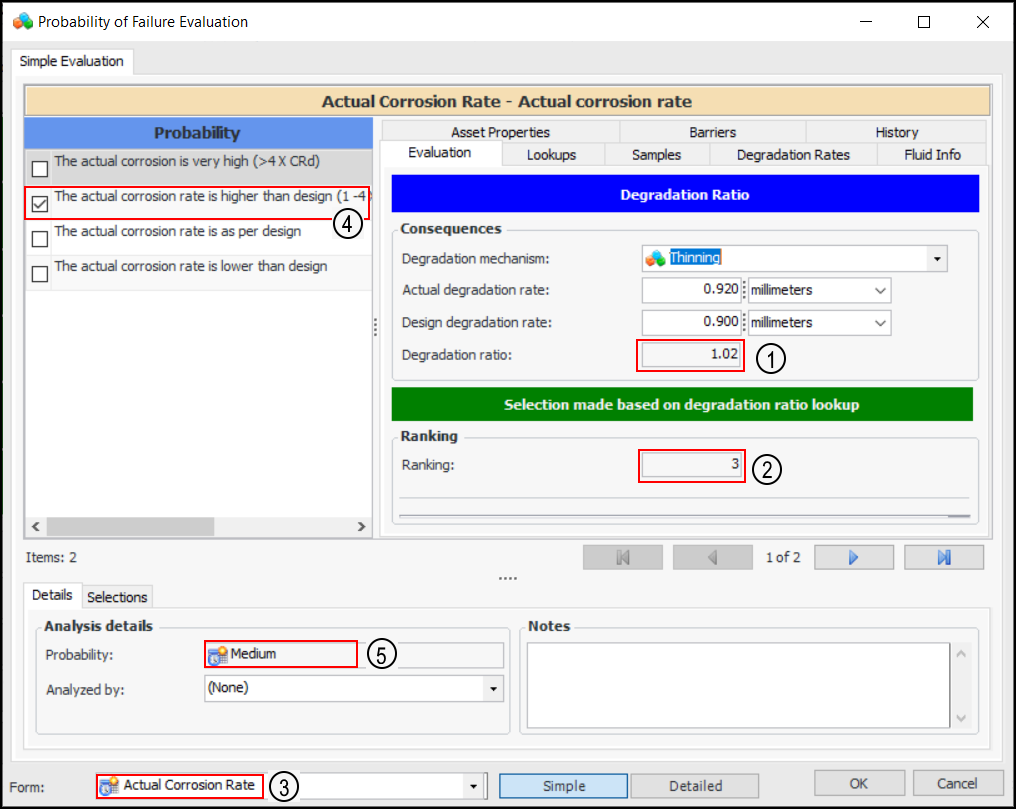
Probability Evaluation
Detectability
Susceptibility Evaluation
Consequence Severities
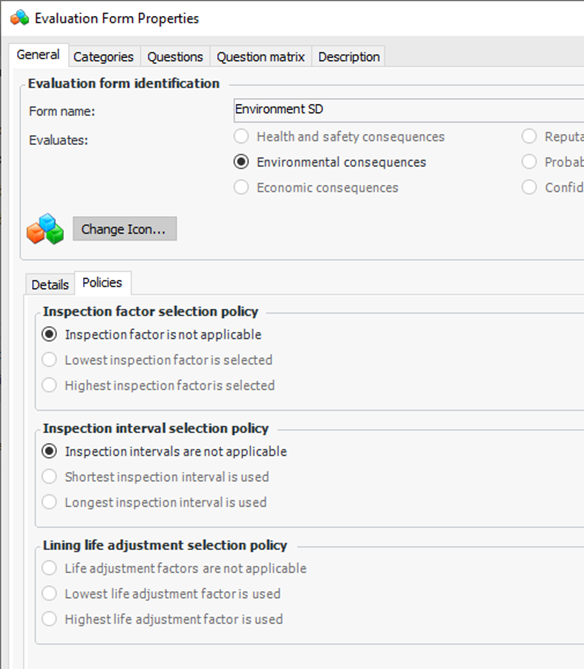
RBI Lookup Tables and Evaluations
Note: Support for criticality evaluation calculations is generally available. However, you must first enable feature 115 to use the functionality in APM. In the Enterprise window, select the Features view and the Enabled Features tab. Click Browse, select “Practical RBI - criticality evaluation calculations” and click OK. If APM is running as a smart client, click Refresh Enabled Features on the server. Then restart the client to use the functionality.
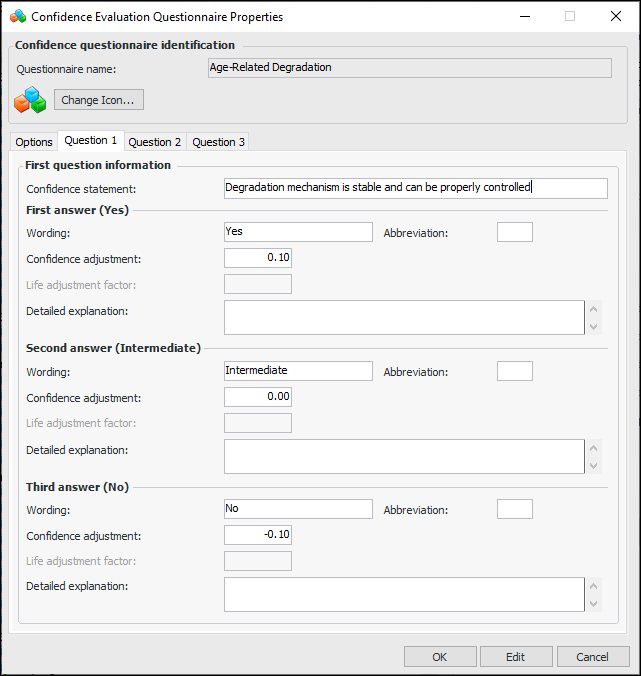
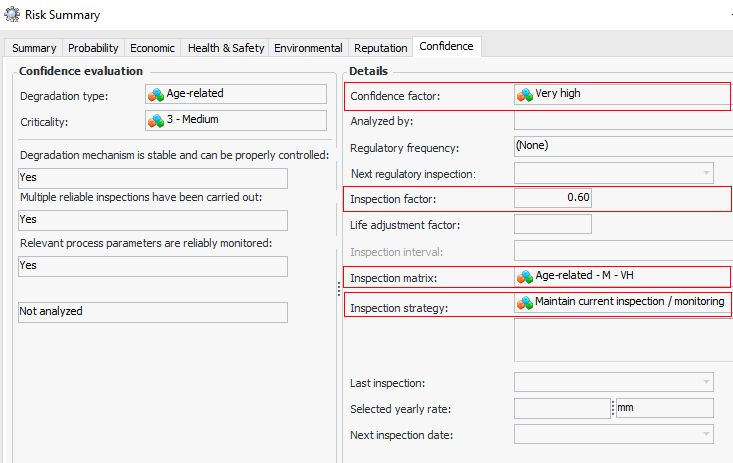
Failure Mode Confidence Evaluation
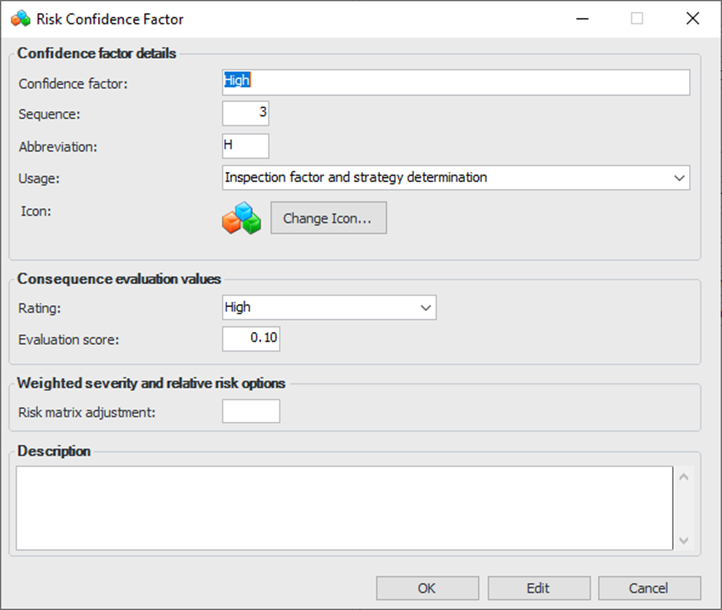
Confidence Factor
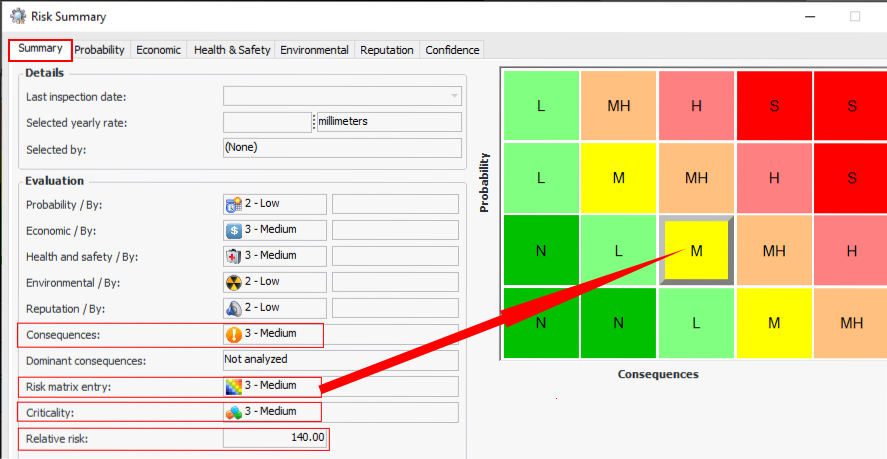
Resulting Risk Scores
Consequences
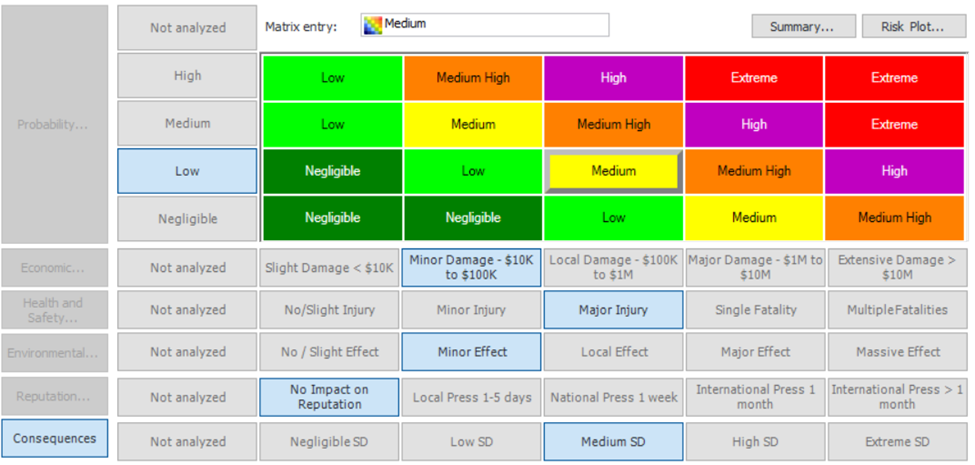
Risk Matrix Entry
Criticality
Relative Risk score
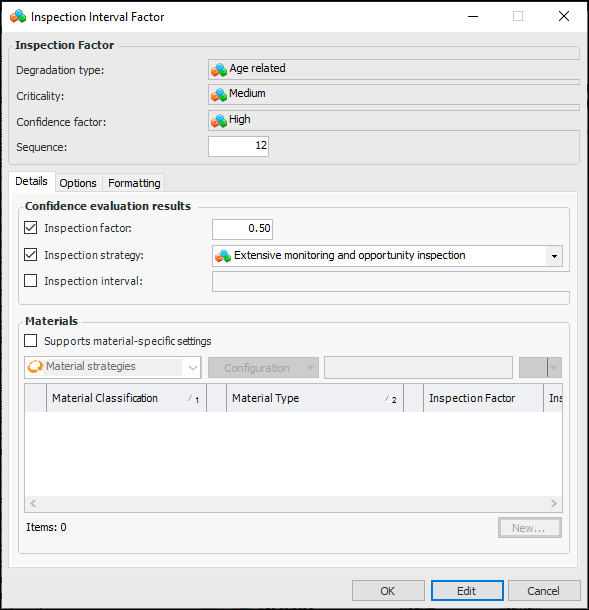
Inspection Factor
Inspection Matrix
Inspection strategy
Life Adjustment Factor (part of Degradation Rate)
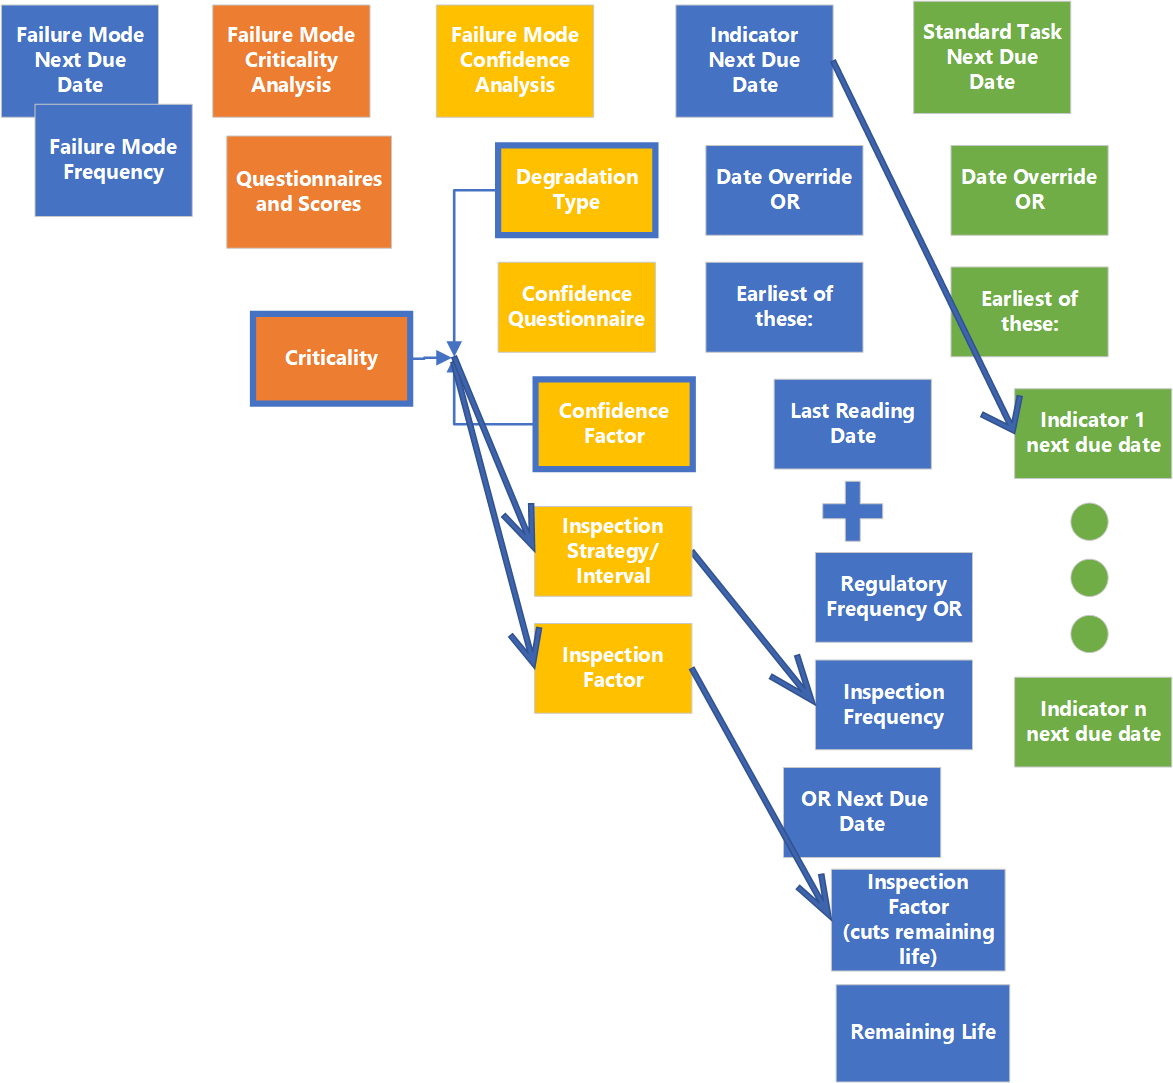
Next Inspection Due Date
Indicator Next Inspection Due Date
Standard Task Next Inspection Due Date
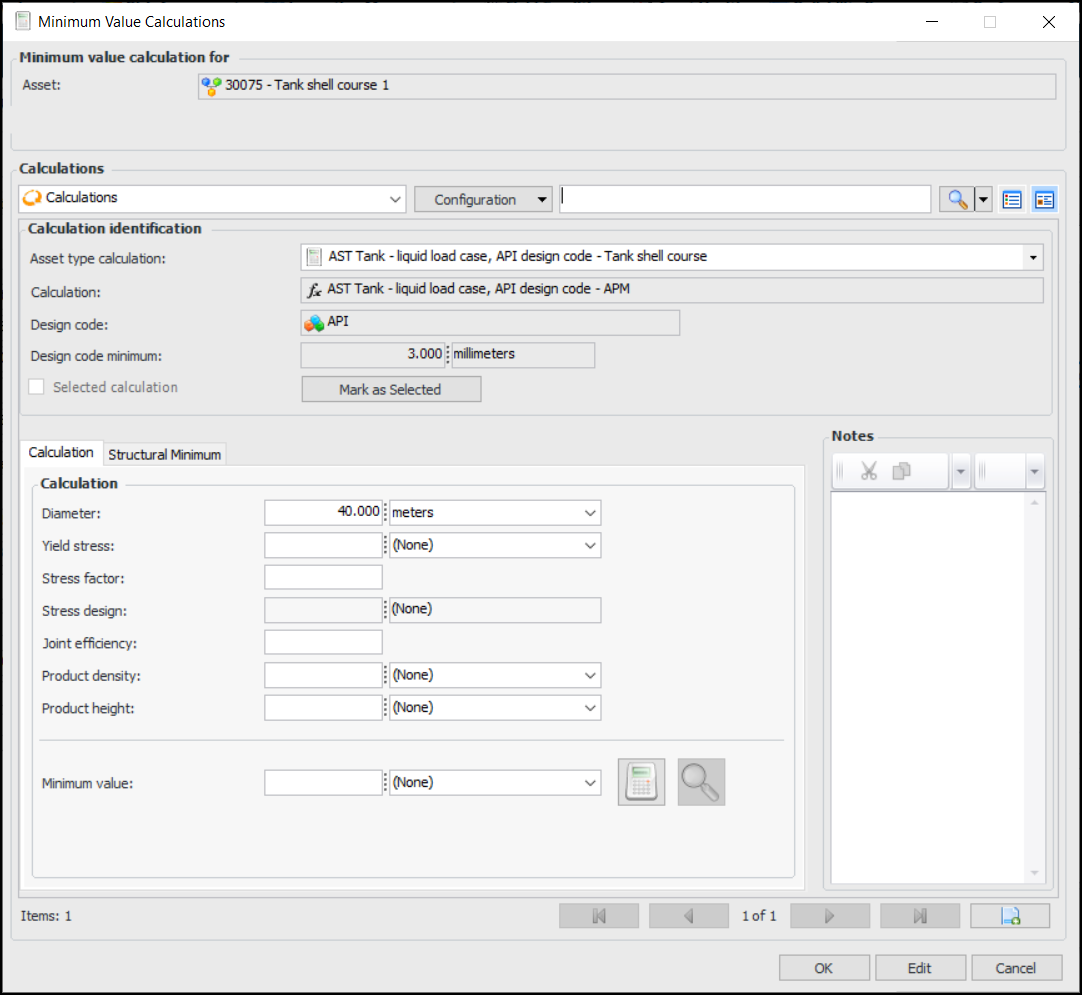
Degradation Minimum Value Calculations
How the Calculations are Used
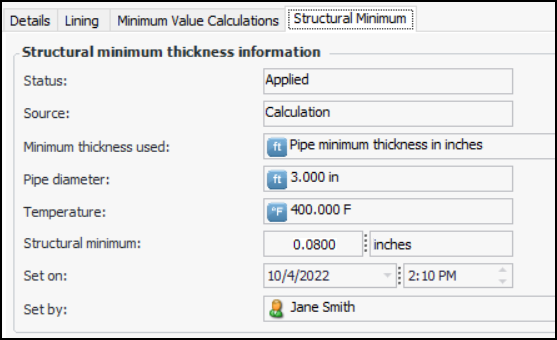
For assets that support it, the Minimum Value Calculator is available on the asset’s design rate, indicator’s rate, and failure mode’s degradation rate. You can open the calculator by clicking the Calculate button. For example:You can enter values, calculate a minimum degradation value, and view the results of the calculation. Add calculation pages as required to try other formulas and inputs. Finally, mark a calculation as selected and click OK to return the result to the degradation rate. For more information about using the calculator, see Adding Degradation Information to an Asset.If you are working with a pipe asset, the asset type might support a structural minimum thickness lookup table. After calculating the minimum value, select the Structural Minimum tab to see whether the structural minimum value was applied. For example:Degradation Minimum Value Calculations Provided
As of version 7.19, the following calculations are included in the APM install database. View them with an Admin license in the Enterprise window, Customization Center view, Calculations tabs.