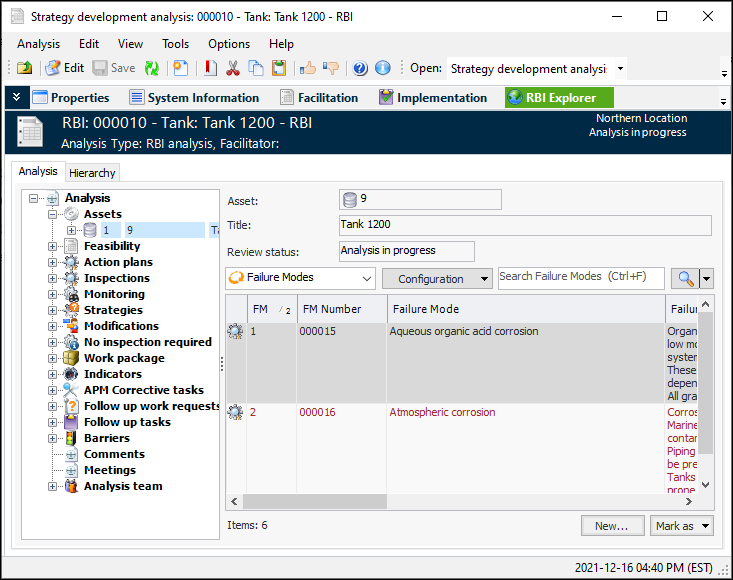
Viewing Information About an RBI Analysis

There are several ways to view detailed information about an analysis in the Strategy Development Analysis window:
To take a comprehensive look at the analysis, select the RBI Explorer view. Select the Hierarchy tab to view assets and their failure modes. The Analysis tab displays a tree of the items associated with the analysis, such as assets, feasibility assessments, action plans, indicators, and team members. The table to the right shows information about the item selected in the tree. For example, select an asset to see a list of its failure modes:
To review how the analysis is implemented, select the Implementation view and the Implementation Audit tab. This tab offers configurations showing inspection tasks without indicators, scheduled restoration tasks without corrective tasks, modifications without a project, and so on.
To view summaries and counts of action plans, indicators, corrective tasks, and inspection tasks, select the Analysis Summary view. This view also lists the symptoms assigned to failure modes on the Fault Guide tab.
To view tables of action plans according to action type, select the Action Plans view and then choose the action type from the list of configurations. This view also shows a chart comparing the plans by action type and detailed information about the template on which the analysis is based.
Tip: To view charts of action plans by task type and status, make sure that your employee record includes the Site sidebar setting “APM standard sidebars”.
This view also lists the failure modes that were copied from the Damage Mechanisms Library.
To view a history of the changes made to the analysis, select the History view. The History view displays the Analysis Audit Info, Asset Audit Info, Status, and Copy Requests tabs.
The rest of this topic explains the information displayed on the Analysis Summary, Confidence Analysis, Barriers Summary, and History views.

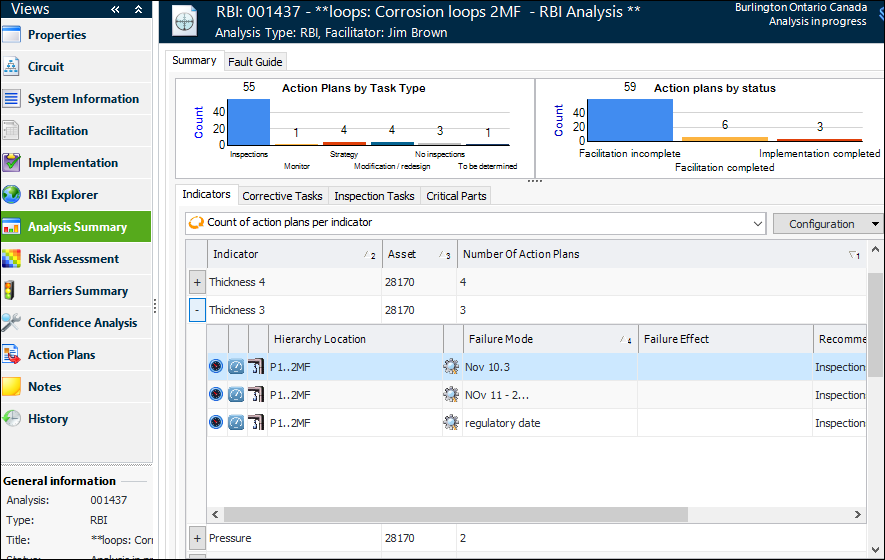
To View an Analysis Summary

1.
From the site’s Strategy Development view and tab, select the RBI tab.
Tip: You can also open an analysis from the asset’s Strategy Development view and tab. Select the Strategy Development tab.
2.
3.
Select the Analysis Summary view.
Note: The Action Plans by Task Type and Action Plans by Status charts shown in the following example are set up as sidebar dashboards and assigned to employees. For more information, see Dashboards.
This view displays:
The Indicators tab shows counts of the action plans for indicator. Click to expand an indicator’s list of action plans.
The Corrective Tasks tab shows counts of the standard tasks and jobs. Click to expand the list of tasks or jobs.
Tip: If APM has been configured for read-only access to an external CMMS (SAP Plant Maintenance), any references to corrective tasks in that system are also displayed in the count of tasks.
The Inspection Tasks tab shows a list of the inspection standard tasks assigned to action plans.
The Critical Parts tab lists the materials requested on action plans to perform the actions.
If you record symptoms on failure modes, select the Fault Guide tab to view the symptoms identified in the analysis.

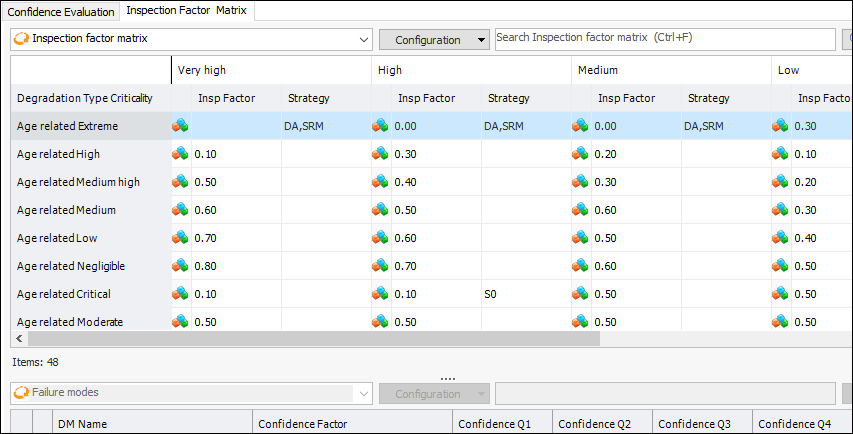
To View Confidence Analyses

1.
2.
Select the Confidence Evaluation tab to view the failure modes, their degradation types, and the scores for their confidence evaluations.
3.
Select the Inspection Factor Matrix tab to view the inspection factor matrix. Select an icon to view the failure modes assigned to each entry in the matrix. For example:

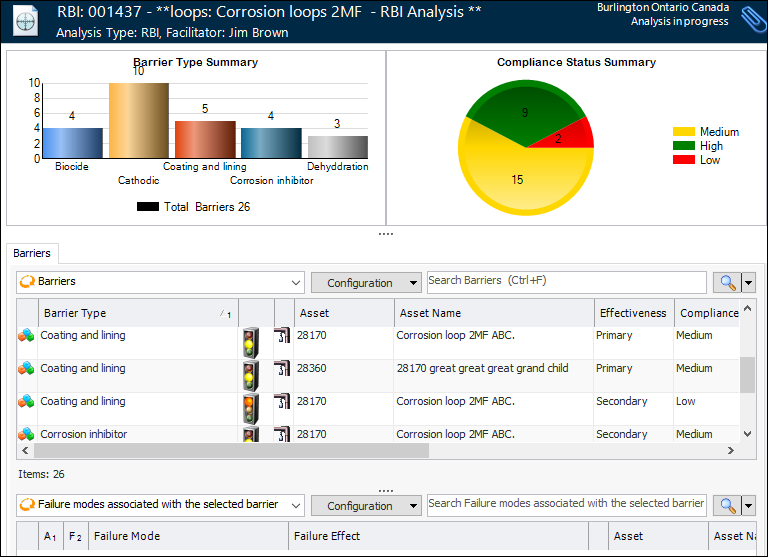
To View Barriers used on the Analysis

1.
In the Strategy Development Analysis window, select the Barriers Summary view. This view shows barrier types and compliance statuses in use. Select a barrier type to view the failure modes associated with the barrier in the table below. Several table configurations are available, for example, the “Threats matrix by barrier type and barrier”:
Note: The Barrier Type Summary and Compliance Status Summary charts shown in this example are set up as sidebar dashboards and assigned to employees. For more information, see Dashboards.

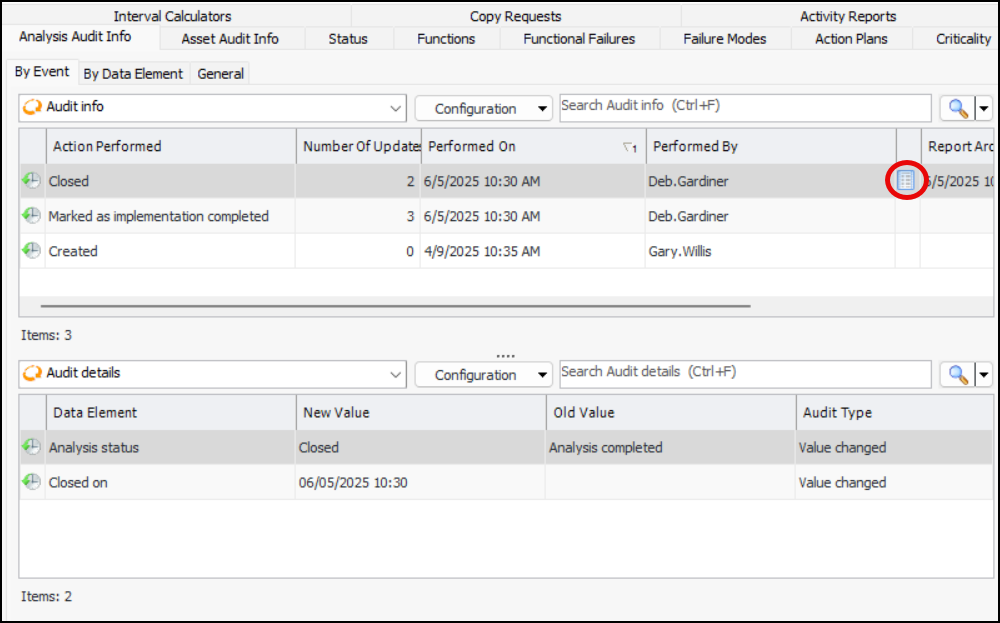
To View Analysis History

In the Strategy Development Analysis window, select the History view.
This view displays:
On the Analysis Audit Info tab, the By Event and By Data Element tabs list the actions performed on the analysis, the date when each action was performed, and the APM user who performed it. Whether you view the actions according to event or data element, you can see the new and old values for each data element.
On the Analysis Audit Info tab in the example, the By Event tab displays an icon for the audit report created when the analysis was marked “Closed”. Double-click a report icon to open the document.
Tip: The type of report and its format (for example, PDF or plain text) are defined in the analysis type assigned to the analysis. For information about enabling this feature, see Setting up Analysis Types.
The General tab displays the date and time when the analysis was created and last updated, as well as the APM users who performed the actions.
The Asset Audit Info tab displays actions performed on the asset by event and by data element.
The Status tab displays the dates on which milestones were completed on the analysis, as well as its current status.
The Copy Requests tab lists occasions when the current analysis was copied, including the status of the copy, the target analysis, and the APM user who performed the action.
The Activity Reports tab lists asset activity reports for the analysis, and reports in which this analysis is included.