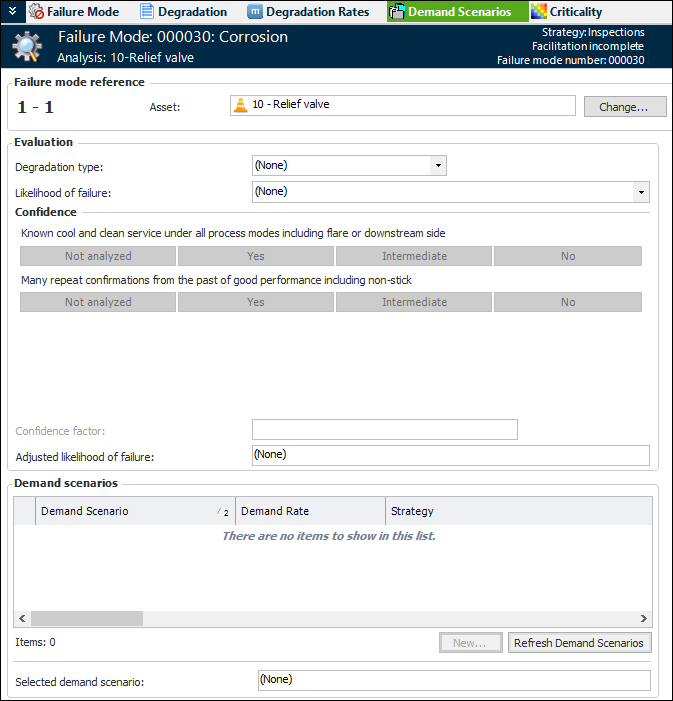
Performing RBI Demand Scenario Risk Analysis

APM provides a method of performing risk analysis on safety devices that protect equipment, people, and environments from events such as pressure build-up, fire, or equipment failure. Risk analysis is performed on one or more demand scenarios identified on the failure mode.
A demand scenario is a situation that requires that an asset, such as a safety device, be put into operation. Examples of demand scenarios are fire, power failure, and blocked outlet.
When demand scenario analysis is performed, probability of failure is based on the likelihood of failure and demand rate. The analysis team determines the probability by:
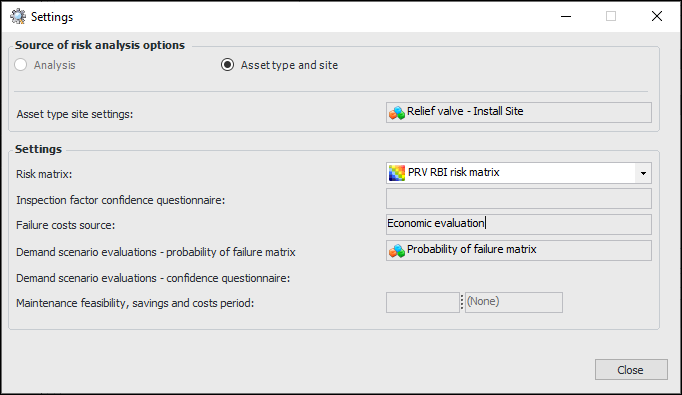
Note: Before you can perform demand scenario analysis, the likelihoods of failure, confidence questions, demand rates, demand scenarios, and probability matrix must be set up in the site’s strategy development settings. For more information, see Failure Probability Settings.
This topic explains using evaluation forms to perform demand scenario risk analysis. It explains how:

To View the Failure Mode’s Settings

The failure mode’s default risk analysis options, for example, the selected risk matrix, come from one of these sources:
The strategy development analysis. Risk analysis options can be set manually (Properties view, Risk Options tab) or defaulted from the analysis type assigned to the analysis.
To quickly see where a failure mode derives its settings, click the Tools menu and then Settings. The Settings dialog appears, showing the source and settings. For example:

To Evaluate Likelihood of Failure and Confidence

1.
2.
3.
Select the Demand Scenarios view. For example:
4.
5.
6.
In the Confidence area, select responses to the confidence statements. (These statements are defined in the confidence questionnaire created by your organization.)
The Confidence factor box displays the result of your selection, indicating if confidence is low or high. The confidence factor can adjust the likelihood of failure up or down. The result is shown in the Adjusted likelihood of failure box.
You are now ready to add the demand scenarios that apply to the asset and complete the probability of failure evaluations for each one.

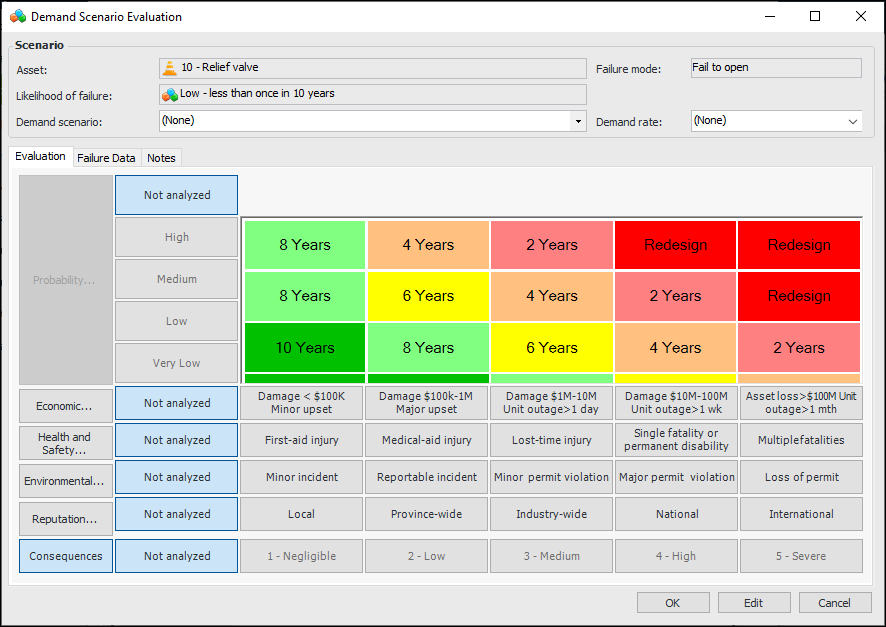
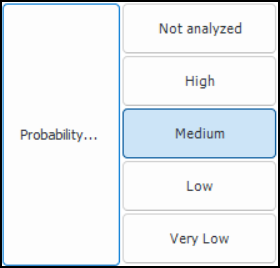
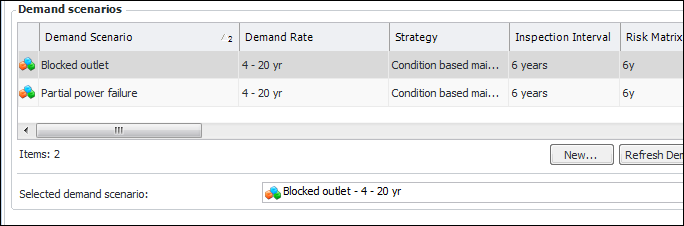
To Add a Demand Scenario and Evaluate Probability of Failure

1.
In the Demand Scenarios view, click New to add a demand scenario. The Demand Scenario Evaluation dialog appears. For example:
The Scenario area displays the asset and failure mode information, as well as the adjusted likelihood of failure.
2.
From the Demand scenario list, select the event that requires the safety device to be put into operation, for example, “Power failure” or “Blocked outlet”.
3.
If the demand scenario properties include the demand rate, it is displayed in the Demand rate box. You can change or add the demand rate if one is not supplied. In the Demand rate list, select the frequency with which the device is expected to be needed, for example, “0.5-4 years”.
The result of the probability evaluation is shown in the risk matrix chart. For example:
To complete each demand scenario’s risk analysis, evaluate the severity of failure consequences. Questionnaires are typically available for economic, health and safety, environmental, and reputation consequences.
Tip: If risk analysis settings allow, you can click the impact buttons in the risk matrix rather than stepping through the questionnaires.

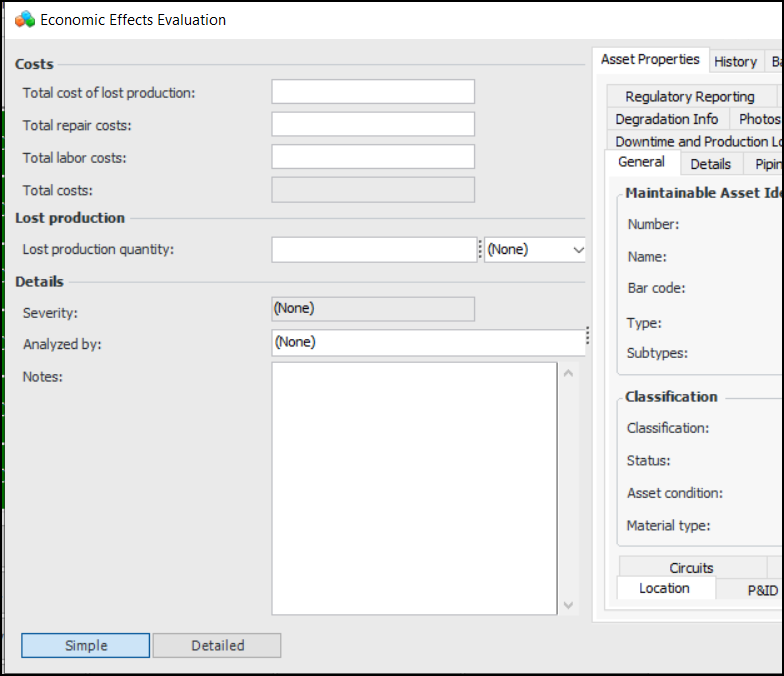
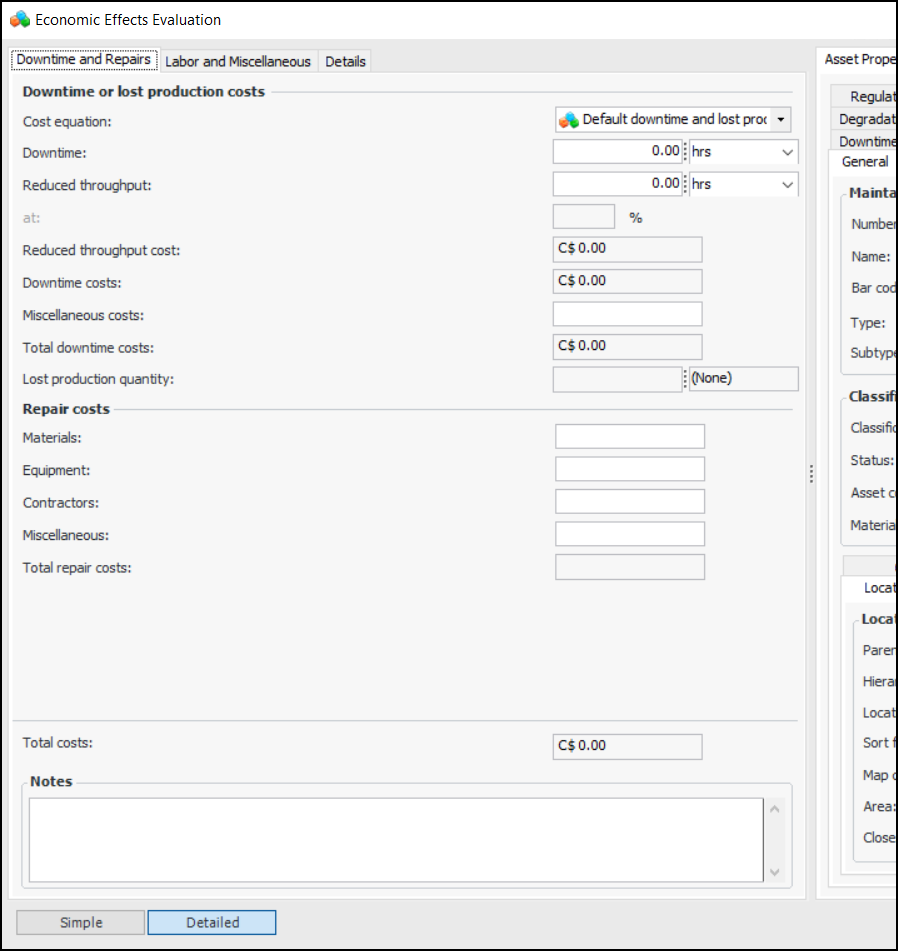
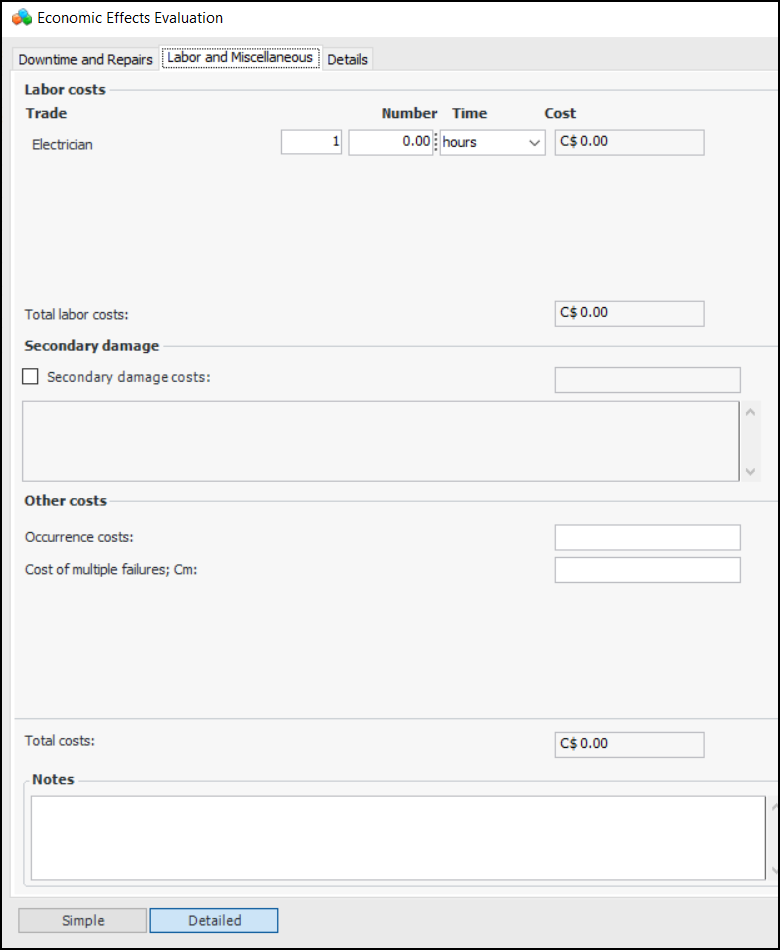
To Evaluate Economic Effects of Failure

1.
In the risk matrix, click Economic. The Economic Effects Evaluation form appears. For example:
At any time, you can refer to the Asset Properties tab for detailed information about the failure mode asset.
2.
As you enter amounts in the Total cost of lost production, Total repair costs, and Total labor costs boxes, APM calculates the total amount and the severity.
3.
To perform a more detailed evaluation, click Detailed. Here is an example of a detailed form:
As information is added to the form, APM calculates the total costs for the failure and displays the Severity score. All monetary amounts are shown in the site’s currency.
4.
Tip: Select the Asset Properties tab and then the Downtime and Production Loss tab to view the production loss cost equation.
5.
6.
Select the Labor and Miscellaneous tab. For example:
7.
Enter information to calculate labor costs. The number and types of trades listed in the Labor costs area are defined in the Economic Evaluations settings. They vary depending on the trades defined for the site and selected for the evaluation. For each trade, enter the amount of time required to respond to the failure. APM calculates the cost based on the trade’s rate.
8.
Secondary damage is additional damage caused to other assets by the initial or primary failure. If appropriate, select Secondary damage costs and enter an amount and a description of the damage. This information is included in the total costs and shown on the failure mode’s Failure Data tab.
9.
In the Occurrence costs box, enter the estimated fixed cost associated with a downtime occurrence. For example, this could be a fixed cost associated with restarting a machine after it has been shut down.
When failure mode optimization requires Isograph Availability Workbench, this attribute is mapped to project effect per occurrence cost in AWB.
10.
In the Cost of multiple failures box, enter the estimated cost if a protected function fails while its protective device or protective system is in a failed state.
11.
In the Notes box, you can enter additional information about the evaluation. Notes are collected and available in several locations.
12.
Select the Details tab. In the Analyzed by list, select the team member who performed the evaluation.
Note: For information about creating cost equations, see Setting up Production Loss Rules on an Asset.
13.
When you are finished the evaluation, click OK. The result of the economic evaluation is shown in the risk matrix. For example:

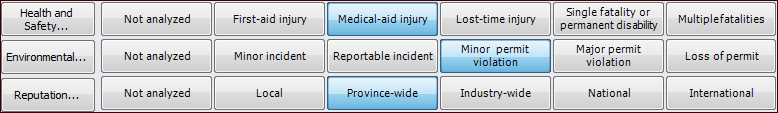
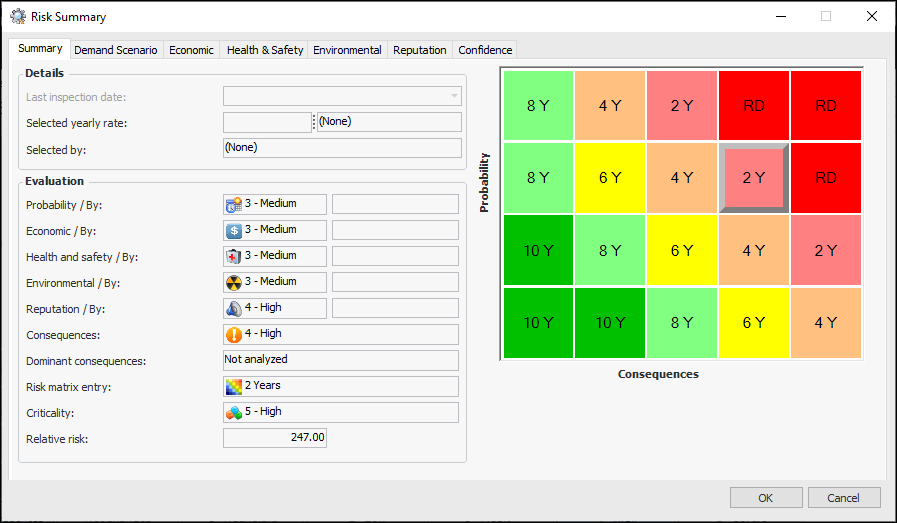
To Evaluate Health and Safety, Environmental, and Reputation Consequences

1.
Click Health and Safety, Environmental, and Reputation in turn. The evaluation form appears. The evaluation types (simple, detailed), categories, and questions available to you depend on the form’s design and the asset properties.
At any time, you can refer to the Asset Properties tab for detailed information about the asset.
2.
As you move through the analysis, the Severity box displays the most severe score assigned to your selections. For example, if you select options for three categories, two of which have a result of “Negligible” and one with a result of “High”, the score for the evaluation as a whole will be “High”. However, if a mitigation category has been defined for the evaluation, its score can raise or lower the severity. The resulting ranking is used in the risk matrix.
3.
In the Analyzed by list, select the team member performing the evaluation.
4.
In the Note box, you can provide additional information about the analysis. Notes are collected and available in several locations.
5.
When you have completed an evaluation, click OK. The evaluation form closes and the result is selected in the risk matrix. For example:

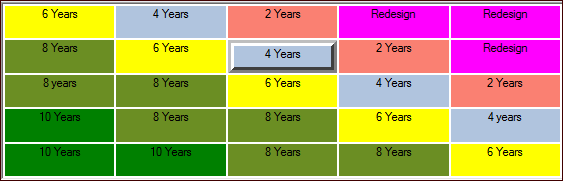
To View Failure Mode Criticality

When you have completed the evaluations for a demand scenario, the risk matrix on the Demand Scenario Evaluation dialog shows the results. For example:
1.
Click OK to close the Properties dialog. Back on the Demand Scenarios view, the scenario is listed in the Demand scenarios table. For example:
The Selected demand scenario box displays the scenario with the highest criticality value.
Tip: Scroll to the right in the table to see the Criticality column. The scenario with the highest number is automatically selected to represent the failure mode.
2.
Select the Criticality view. This view shows the risk matrix chart for the selected demand scenario. You can:
Click Demand Scenario to open the selected scenario’s Demand Scenario Evaluation dialog.
Click Summary to open the Risk Summary dialog. For example:
A tab is displayed for each of the questionnaires that were used to evaluation probability of failure and consequence severities.
Click Risk Plot to view a graph of the risk plot.