|
|


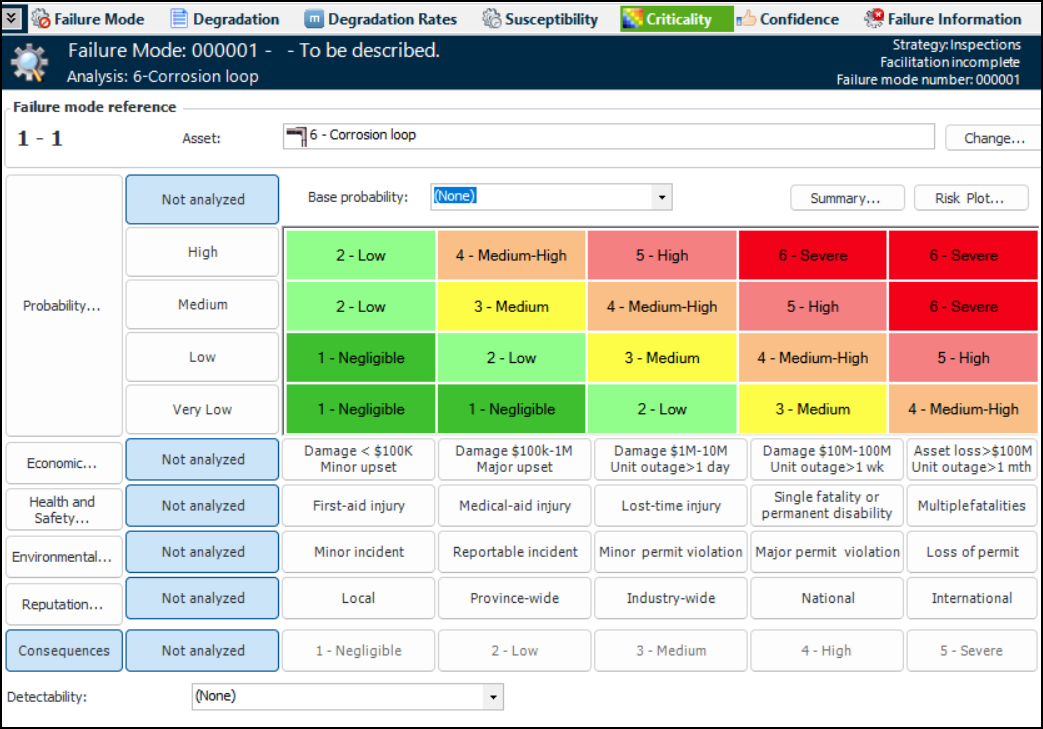
Performing Risk Analysis for RBI Failure Modes
After you have analyzed the failure modes, you can compare failure modes and identify the relative importance of addressing them. The Risk Assessment view in the Strategy Development Analysis window includes failure mode lists based on criticality, consequence priority, severity, and relative risk, as well as a risk plot, risk matrix, and lists of the evaluations. This view is also available for the asset.RBI analyses, typically for assets with Oil and Gas specifications, can use lookup tables and calculations to determine a failure mode’s probability of failure or consequence severity. For example, a health and safety evaluation could calculate the failure mode’s consequence ranking based on the toxicity index value assigned to the asset’s fluid type. For information about using these questionnaires, see Setting up Consequence Severity Evaluations to use Lookup Tables.
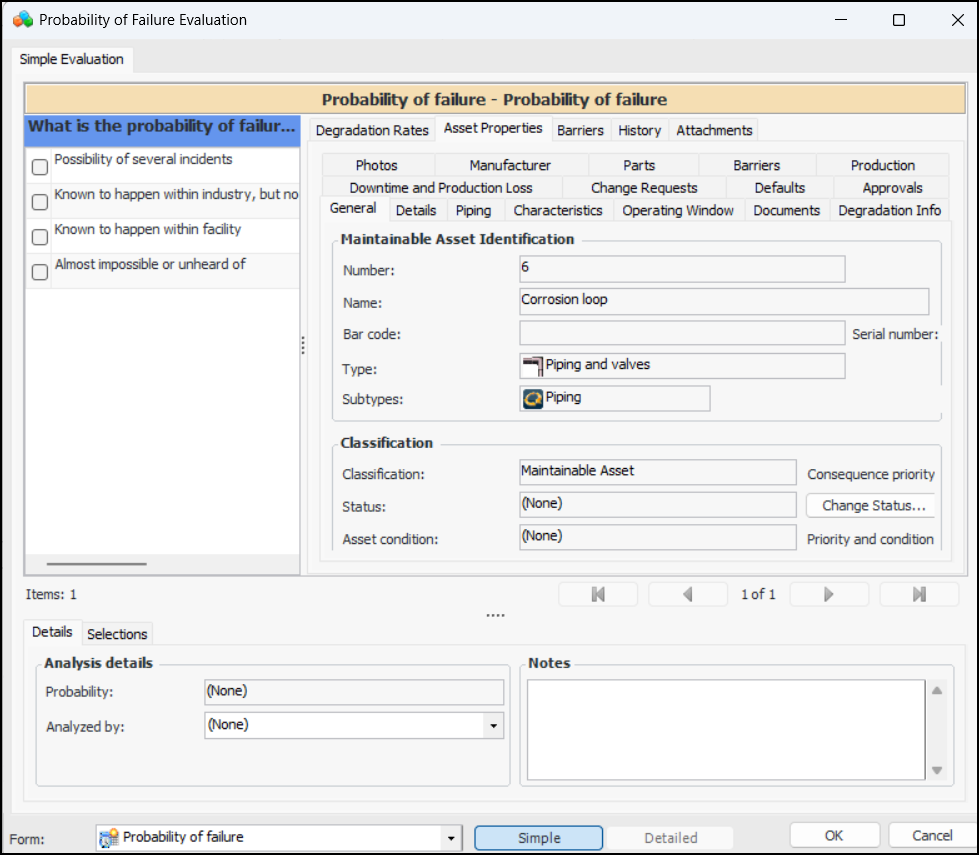
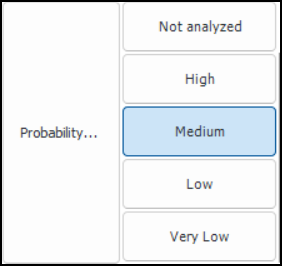
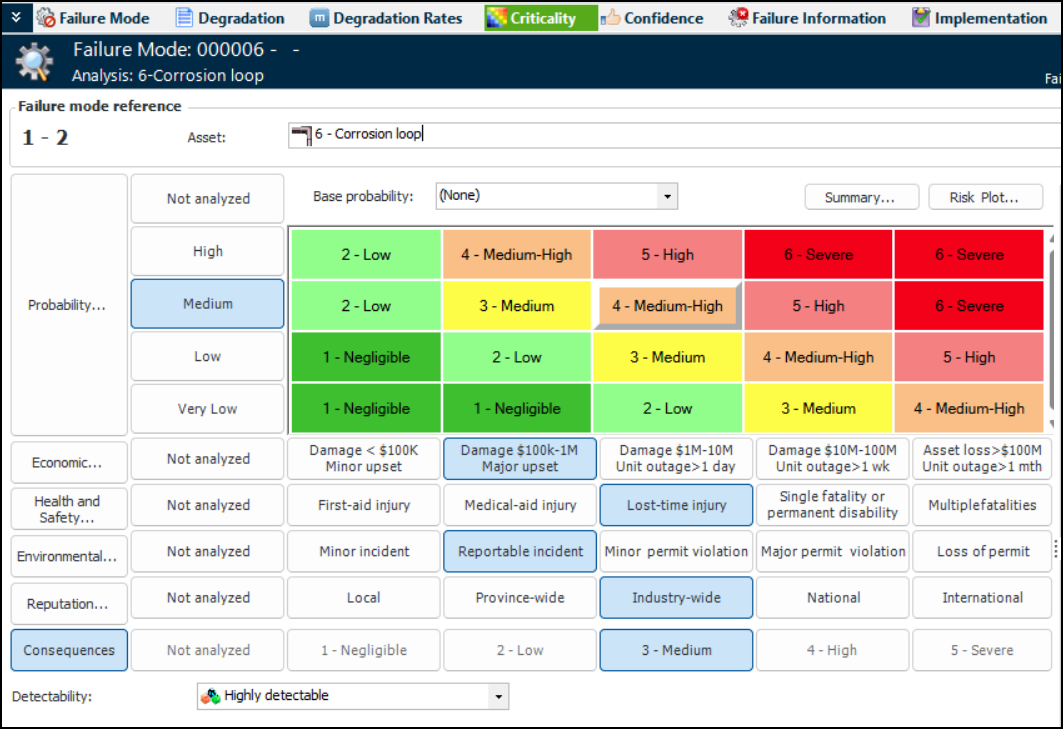
To Evaluate the Probability of Failure
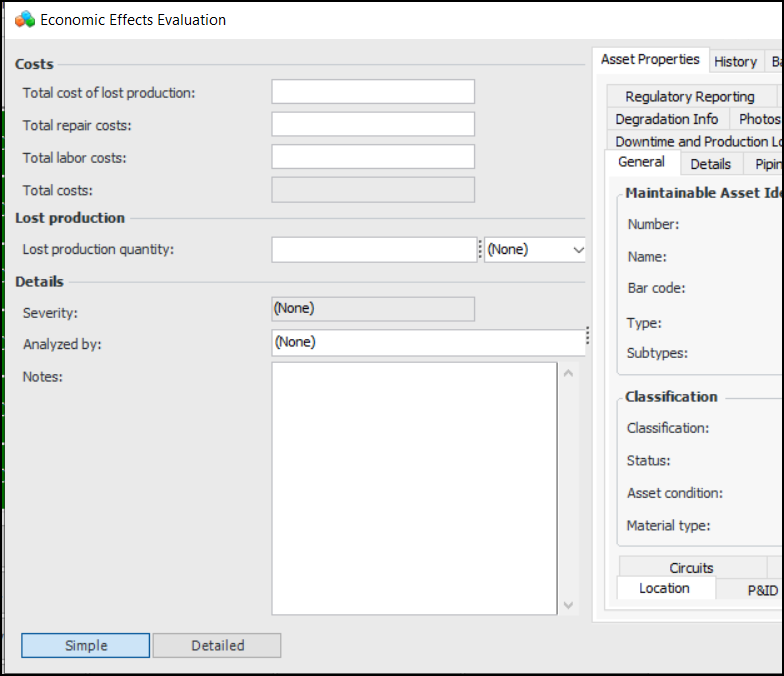
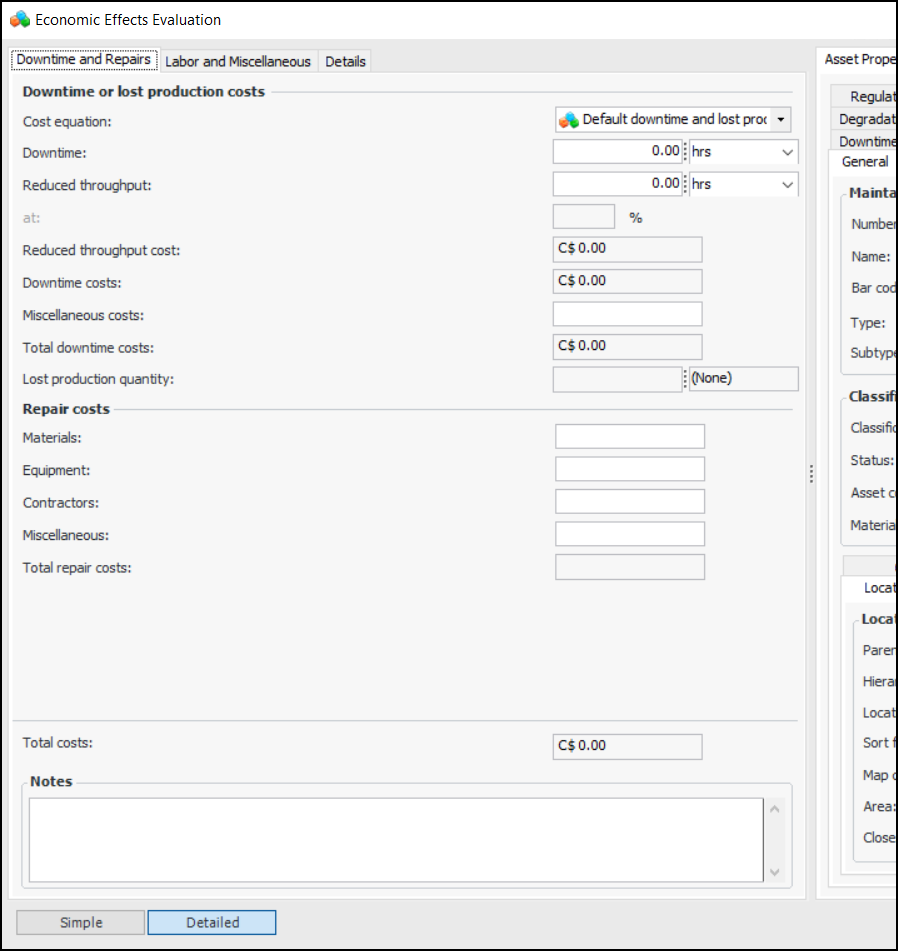
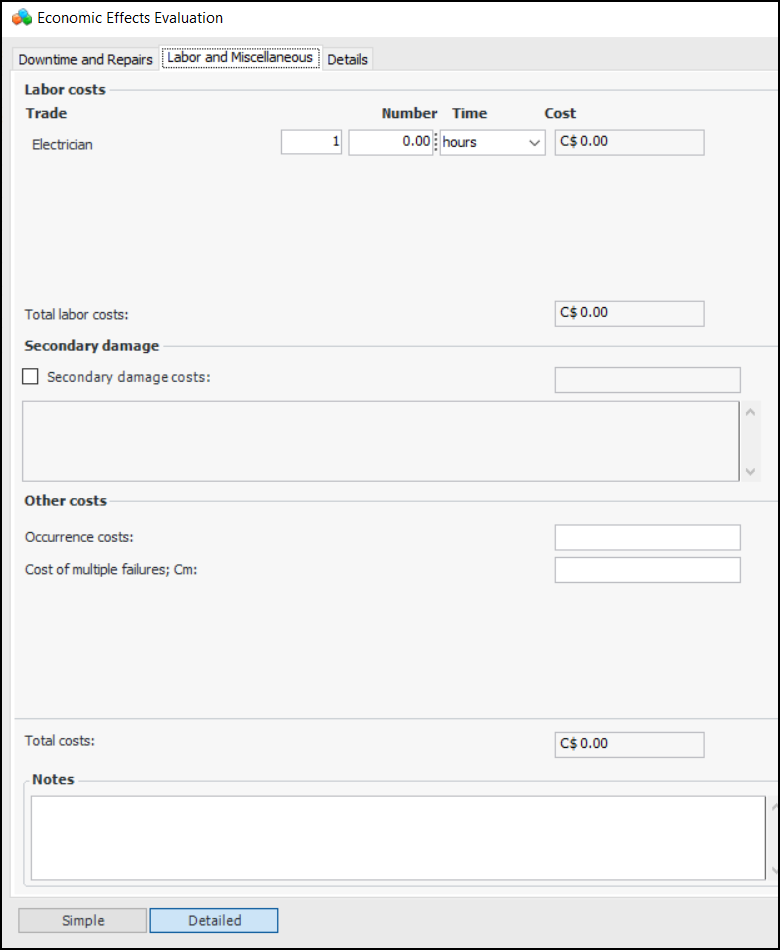
To Evaluate Economic Effects of Failure
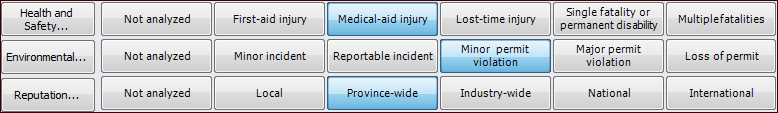
To Evaluate Health and Safety, Environmental, and Reputation Consequences
To Assign a Detectability Value
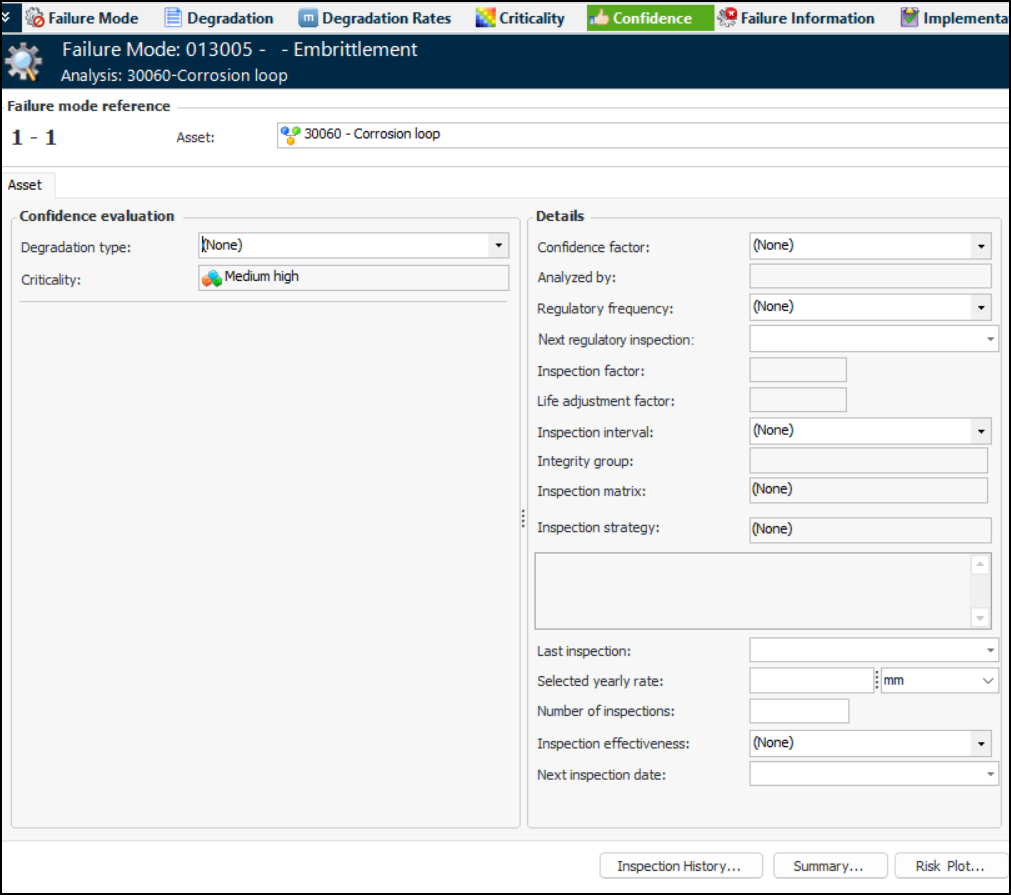
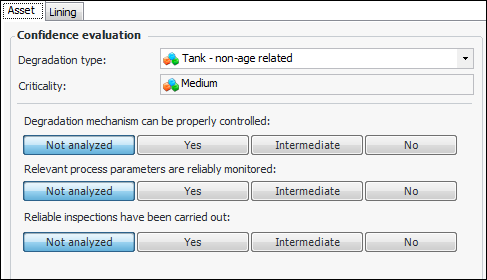
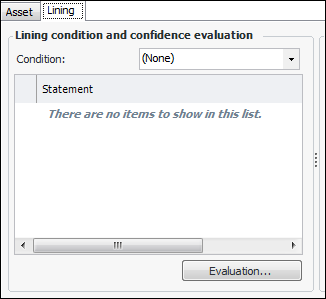
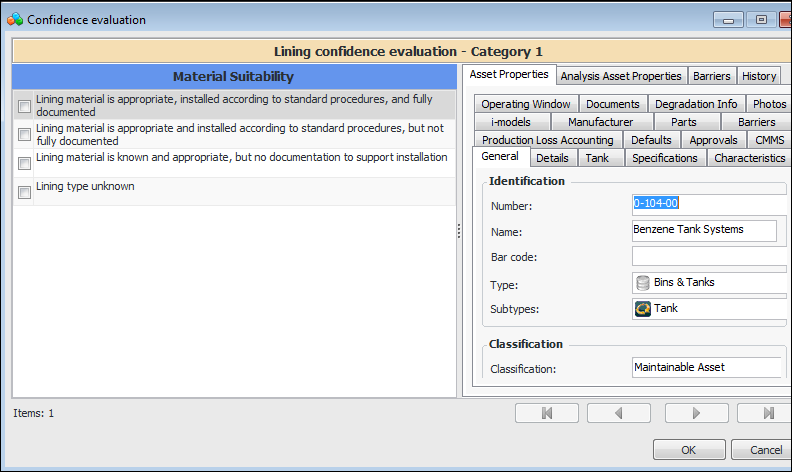
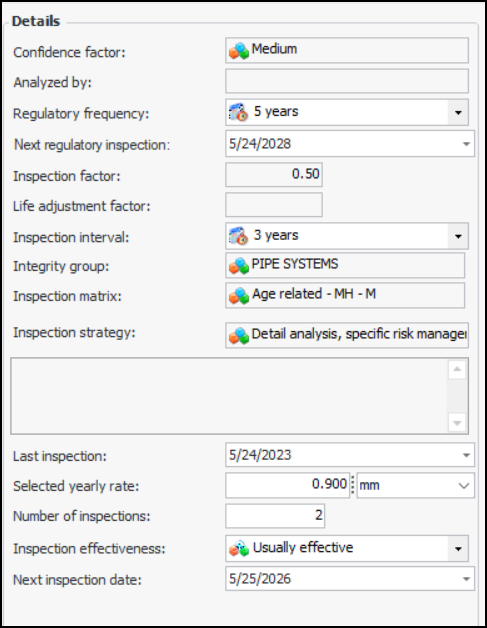
To Evaluate Confidence Factors
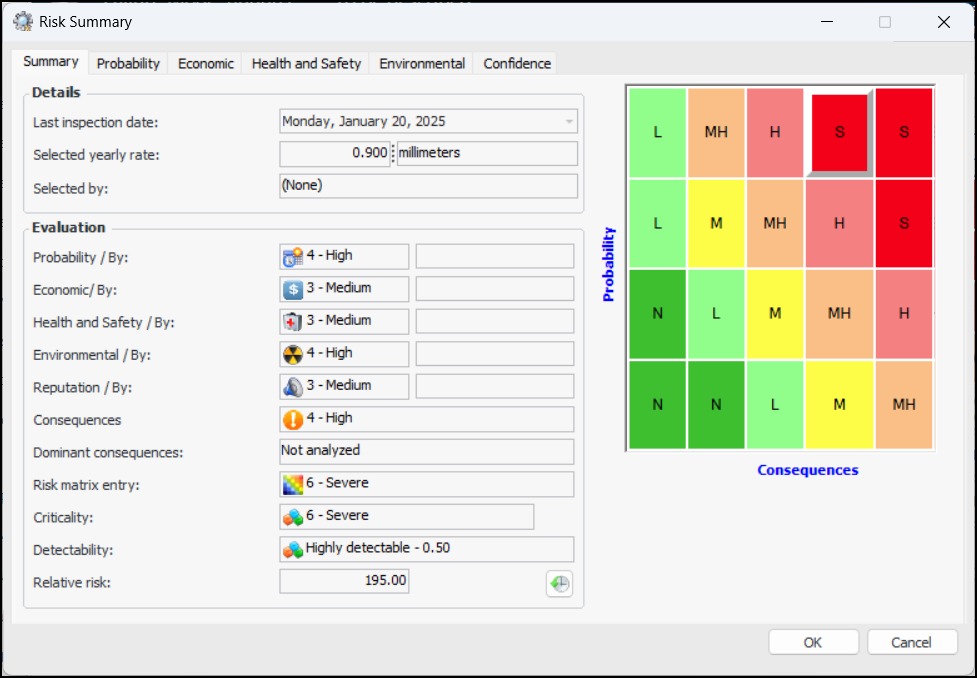
Viewing the Risk Analysis Summary
 is enabled.