|
|


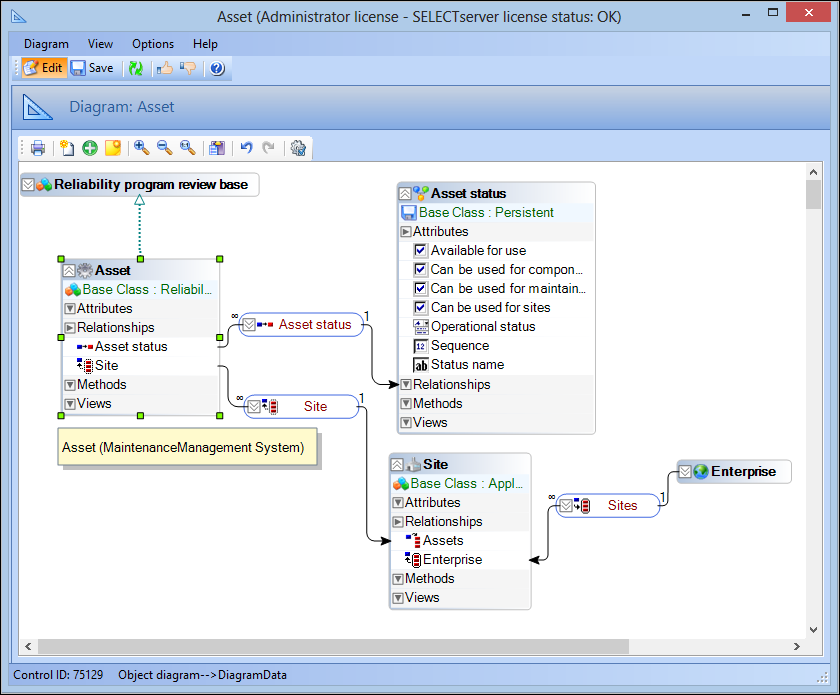
Object Model Diagram Overview
Tool Bar
Legend
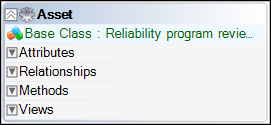
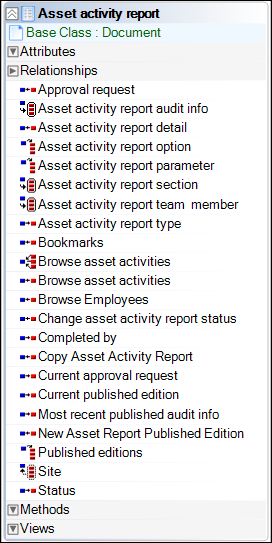
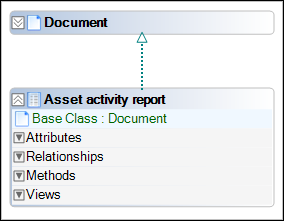
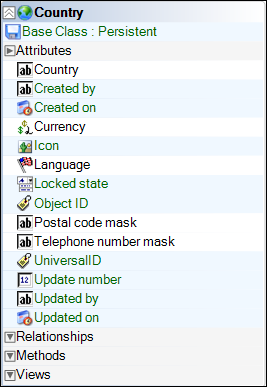
Classes
Inherited Members
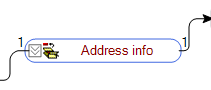
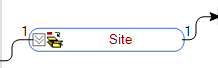
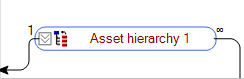
Relationships
Notes