Overview of Online Data Collection

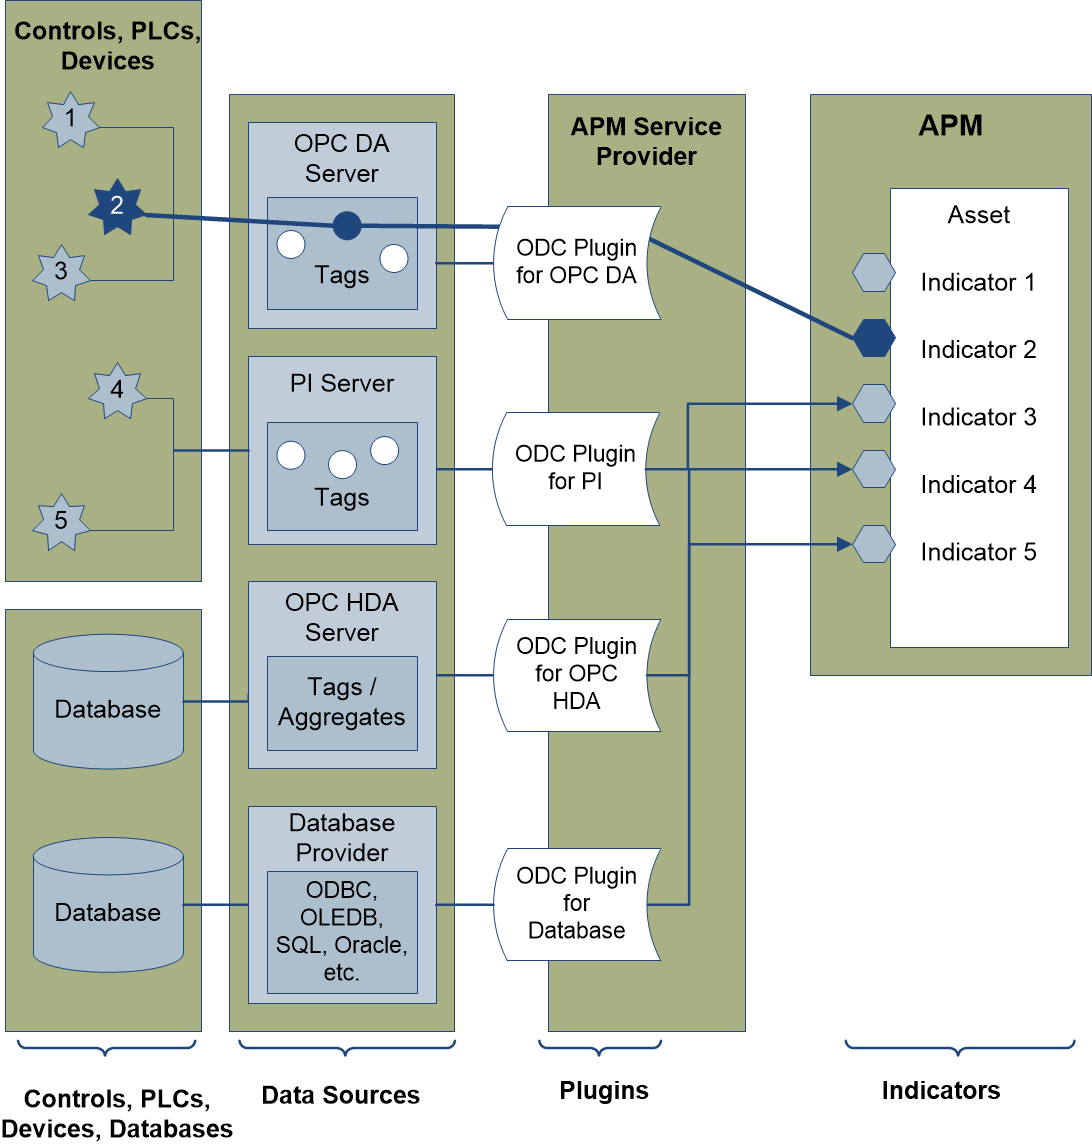
What is Online Data Collection?

The Online Data Collection (ODC) system provides an interface between APM indicator readings and online condition-monitoring devices, for example, Distributed Control Systems (DCSs) or programmable logic controllers (PLCs). The interface involves these elements:
Data collected automatically using an online condition-monitoring device is stored in the APM database. The ODC service provider monitors data from the data source and records indicator readings in APM based on time and rule criteria.
Note: All service provider components, including ODC plugins, must reside on all server machines.

Data Sources

An ODC data source is a representation of an external data source used to collect data. For example, a data source might be an OLE Process Control (OPC)-compliant process (OPC DA) that collects real-time data. A data source (which can be an OPC HDA-compliant process) can also be a data archiver or database that stores historical condition readings.
Data sources reference multiple data tags (data points) collected from an asset. In most cases, the target data source must be connected to your ethernet network so that you can configure a data source in APM and/or for data collection when the ODC service provider is running.

ODC Service Provider

The ODC service provider is an APM plugin hosted within the APM server that monitors data readings provided by external data sources. Once configured and started, the service automatically collects data according to a polling schedule. The appropriate ODC plugin must be set up to collect data (for example, the PI plugin is required for PI servers).
The following ODC plugins are provided:
Custom plugins are also supported (API provided).

APM Indicators

An indicator’s configuration determines when a reading is created and stored in APM. The indicator’s reading creation rule defines the criteria for creating readings and the polling schedule used.
For example, a data source might be an OPC DA server that monitors the level of liquid in a tank. The ODC service, in turn, monitors liquid levels from the tank on a defined schedule. The service relies on the indicator’s creation rule and polling schedule to determine when the tank’s liquid level data is recorded as an indicator reading. For example, a service might check tank level data every 30 minutes but not record it in APM unless the tank level falls below 15 liters. Tank levels above 15 liters are considered normal and ignored.
ODC services assign the time stamp supplied by the data source to the indicator readings they create in order to accurately reflect when readings were taken.
The quality of readings is also returned from the target data source. For example, if data is cached due to a system outage, it might be labeled “bad” or “uncertain” because the data is stale. The reading creation rule specifies the response to quality flags. For example, bad or uncertain quality flags could result in the reading being skipped or marked as incorrect.

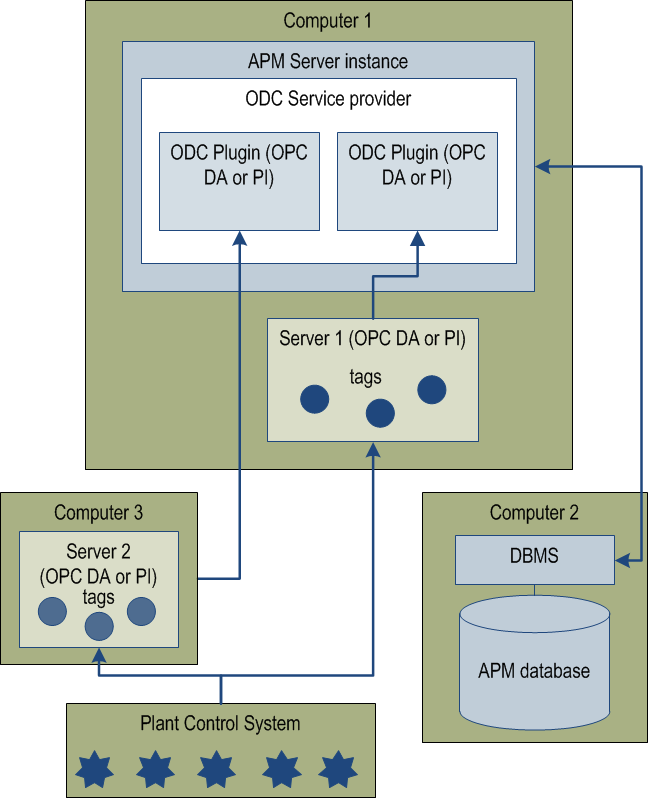
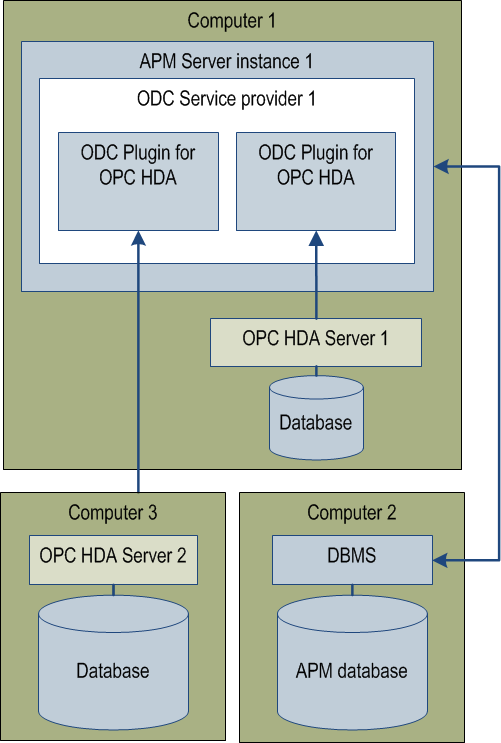
APM ODC Architecture

The following diagram shows the ODC architecture:

APM Servers and Service Providers

Each APM server is identified by the name of the computer on which it runs and its instance name. At least one server instance is created for ODC and assigned a service provider. You can create two or more server instances with the same service provider, for example, to improve performance and overcome the memory restrictions of 32-bit operating systems.
The data source definition in APM identifies the ODC service provider, the appropriate plugin (for example, PI), and the location of the target data source.
At runtime, the ODC service polls the ODC plugin according to the polling schedule assigned to the indicator. Data is gathered from the assigned tags and stored in the APM database.
The same service provider and plugin can be assigned to two or more data sources. This configuration would allow you to monitor different OPC servers to gather the same type of information. Service providers can also be distributed over many computers to improve polling performance.
The following diagram shows example deployments of the plugins that collect real-time data: OPC DA and PI. Each ODC service provider can collect data from target servers on the same or different computers. We recommend that the server instance and APM database reside on separate computers.
The following diagram shows deployment examples for the OPC HDA plugin. Note that two or more APM server instances can reside on the same computer.

Monitoring Service Providers

Administrators use the APM Web Monitor to view the status of target servers and APM services, monitor user activity, send network messages to users, lock the server, view server log files, and perform other server administrative tasks. You can start the Web Monitor from the Server window or APM Server Manager.
Note: Before stopping a server, be sure to check the Web Monitor for any pending service provider activities.
When setting up and testing the APM environment, you will find it useful to run the server in Console mode. The APM Server window opens on the desktop, making it easier to monitor the server’s operation and to stop it when required. When you are ready to move the system into production, you should install the server as a Windows service that runs in the background without a user interface.
A log file lists actions that have occurred in the application or on the server. Logs provide information as to the nature of the transaction that is logged. With logging enabled, you can easily locate problems with an application and take action to resolve them.
APM uses a logging tool called Nlog that allows .NET applications to log output to a variety of output targets. The target can be a file, an event log, or the APM Network Log Viewer utility.

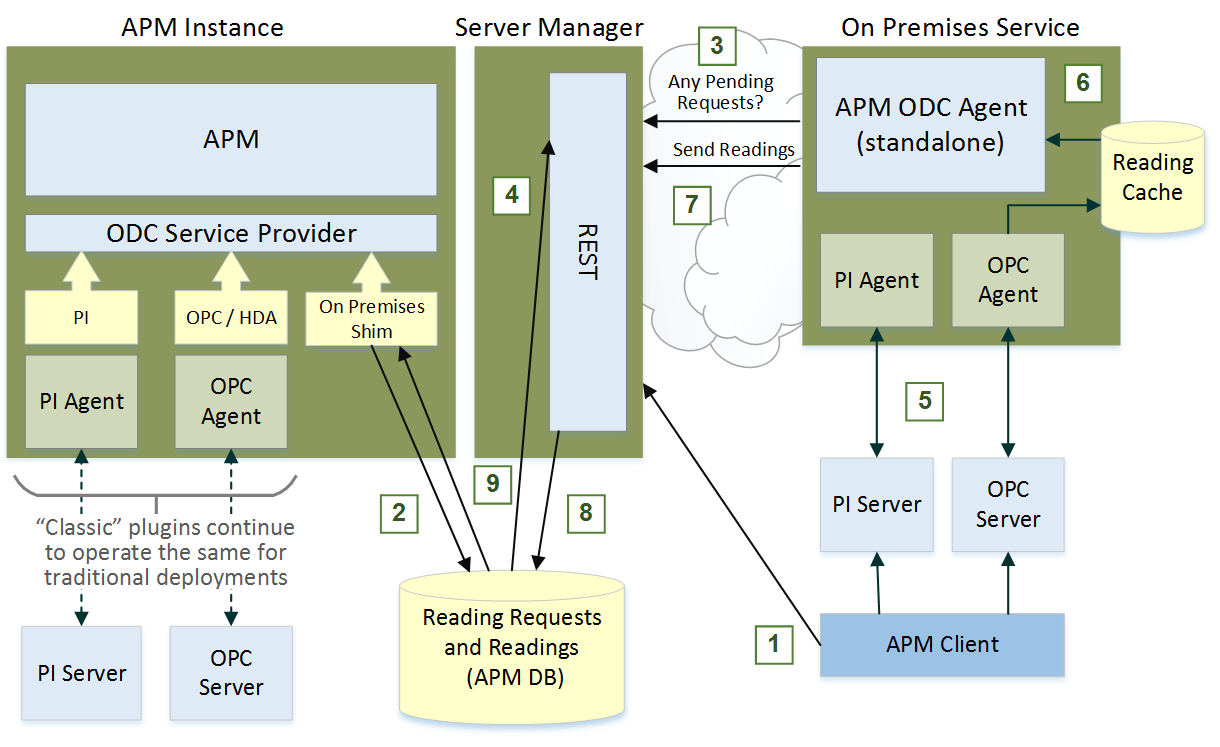
On-Premises ODC Agent

APM online data collection (ODC) also offers an on-premises ODC agent: a stand-alone service that provides communication between data source plugins and the APM Server Manager. The agent makes it possible for APM instances and databases to be hosted in Microsoft Azure®, while data collection from source servers or databases is managed by the APM ODC agent. The agent polls the server looking for indicator reading requests and then uploads the readings.
The following diagram shows the ODC architecture when the on-premises agent is used:
1.
2.
3.
4.
5.
6.
7.
8.
9.