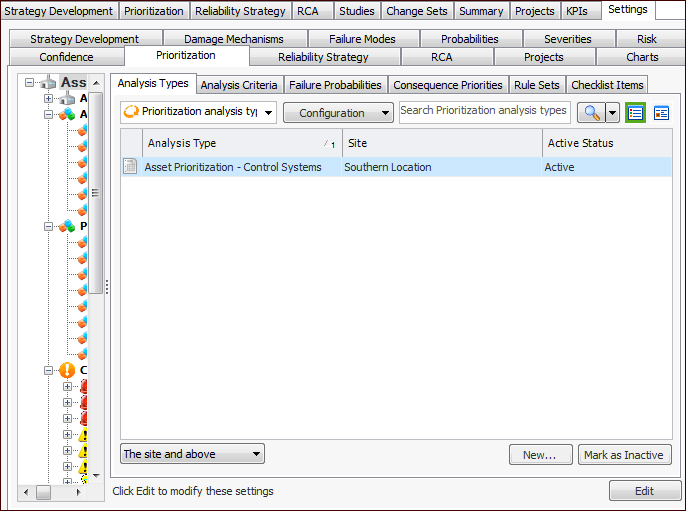
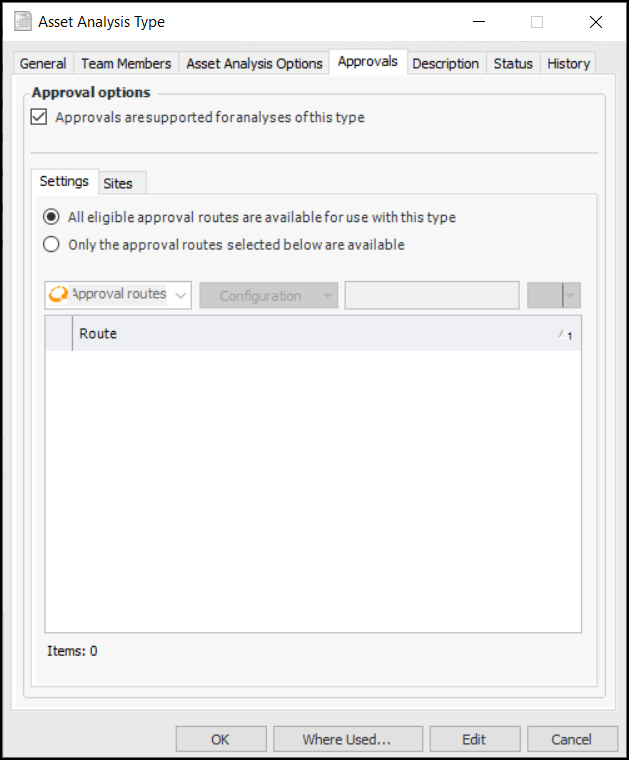
Setting up Analysis Types for Asset Prioritization

An analysis type is a collection of preferred settings for prioritization analysis. The settings include the rule set, risk plot appearance, preferences for applying analysis results, and support for probability of failure analysis. Selecting an analysis type on an individual analysis quickly ensures that these settings are correct and consistent with your organization’s standards.
Tip: Create analysis types that apply to multiple sites at the top site. Create an analysis type that applies to a specific site on that site.
This topic explains how to create analysis types for asset prioritization.

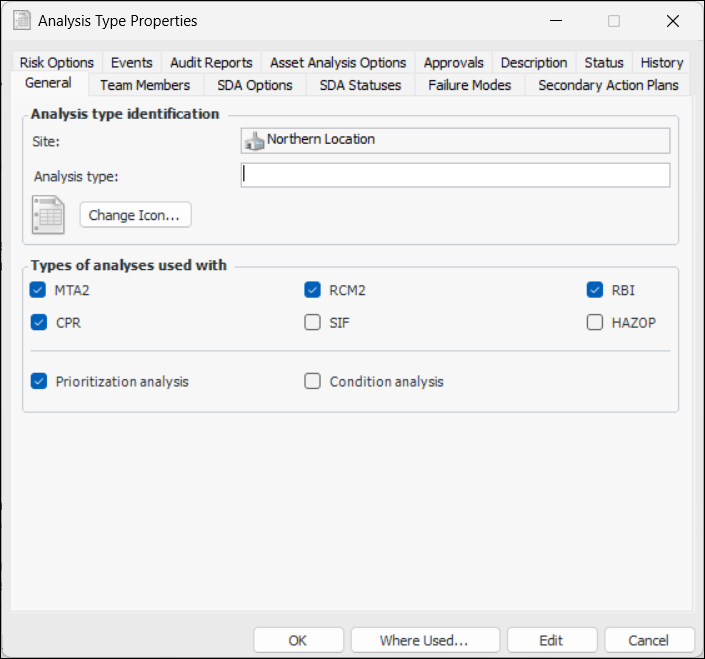
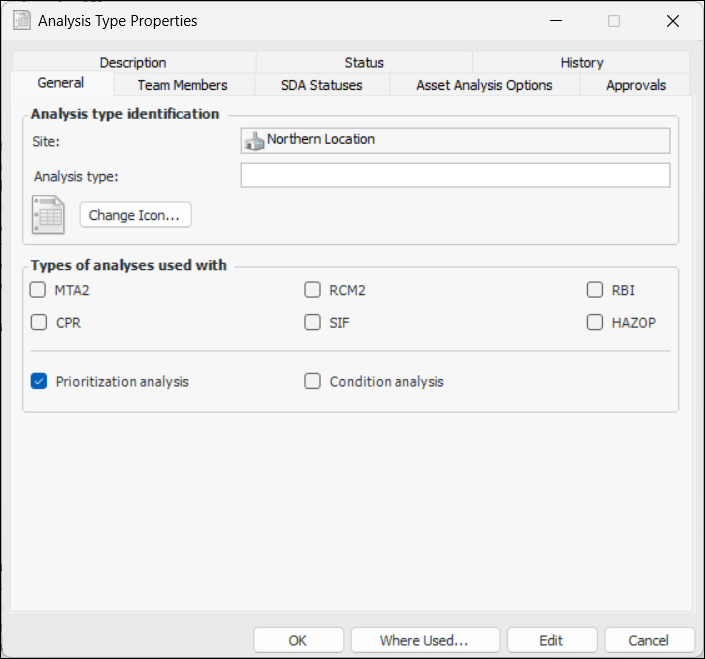
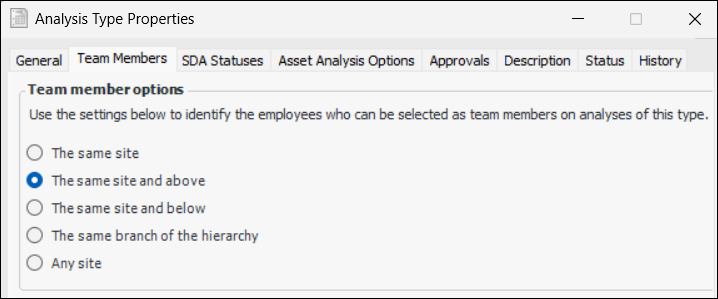
To Set up an Analysis Type

1.
From the Site window, select the Strategy Development view, Settings tab. Select the Prioritization tab and the Asset prioritization settings node in the tree.
Tip: You can also select the Administration menu, Strategy Development Settings, and then Asset Prioritization. The Asset Prioritization Settings dialog appears.
2.
Select the Analysis Types tab. This tab lists the prioritization analysis types for the site.
Tip: While you are developing an analysis type, you can mark it as inactive until it is ready to be used. Select the type in the table and click Mark as Inactive. The Mark as Inactive/Active dialog appears, where you can enter a comment. When you click OK, a confirmation message appears. Click OK. When the analysis type is ready for use, select it in the table and click Mark as Active.
3.
Click New. The Asset Analysis Type window appears.
4.
5.
To change the image that represents this type, click Change Icon, select a different image, and click OK.
6.
In the Types of analysis used with area, clear all of the options except Prioritization analysis. Only the tabs related to prioritization analysis are displayed. For example:
7.
Select the Team Members tab.
Note: Site filtering rules for analysis team members is a “generally available” product feature. You must first enable feature 97 to use the functionality in APM. In the Enterprise window, select the Features view and the Enabled Features tab. Click Browse, select “Support site filtering rules for analysis members” and click OK. If APM is running as a smart client, click Refresh Enabled Features on the server. Then restart the client to use the functionality.
8.
9.
Select the SDA Statuses tab. Study statuses are applied to analyses to control the actions, events, and rules available to them.
10.
By default, all study statuses are available for use. To restrict statuses, select Only the statuses below are available. The table is populated with the statuses defined for the site. Select the statuses to be available.
11.
In the Default analysis statuses area, select a study status to be applied whenever the analysis’ system status changes. For example, when an analysis is created, it could automatically be given the study status “Draft”.
12.
Select the Asset Analysis Options tab.
13.
For more information, see Setting up Prioritization Analysis Rule Sets.
14.
In the Analysis results applied to list, select which assets are updated when the analysis results are applied. The options are:
The analyzed asset only – Only the assets included in the current analysis have their consequence priority numbers updated
The analyzed assets and assets in the same branch of the hierarchy – Only the assets included in the analysis and their descendants and ancestors in the hierarchy have their consequence priority numbers updated
The analyzed asset and assets above it – Only the assets included in the analysis and their ancestors in the hierarchy have their consequence priority numbers updated
The analyzed asset and assets below it – Only the assets included in the analysis and their descendants in the hierarchy have their consequence priority numbers updated
15.
Update previously analyzed assets is selected by default. This option takes into account the selected Analysis results applied to option. For example, if descendant assets are to be updated and Update previously is selected, all assets below the analysis asset in the hierarchy are updated, whether they have been analyzed separately or not.
If Update previously is not selected, descendant assets are updated until the system identifies an asset that has been analyzed separately. At that point, the update process stops.
16.
In the Probability of failure options area, choose the analysis method:
Select from a list of probabilities – When performing the prioritization analysis, you can select one of the failure probabilities defined for the enterprise
Probability criterion analysis – Perform a probability analysis when performing an asset prioritization analysis
Note: To use probability criterion analysis in APM, you must first enable feature 39. In the Enterprise window, select the Customization Center view and the Enabled Features tab. Click Browse, select “Criteria based probability evaluation on an asset prioritization analysis”, and click OK. If APM is running as a smart client, click Refresh Enabled Features on the server. Then restart the client to use the functionality.
17.
If you selected Probability criterion analysis, specify how the results are selected. Options for the selection policy are:
Highest ranking – Of the examples that the user chooses during the analysis, the one with the highest score is selected. The score is matched to a probability of failure
Sum of selections – The scores for the chosen examples are added together and the probability closest to, but not less than, the sum is selected
Lowest ranking – Of the examples the user chooses during the analysis, the one with the lowest score is selected. The score is matched to a probability of failure
Probability criteria matrix – The selected matrix is used to determine the probability of failure
18.
On the Risk Plot tab, select the appropriate appearance option:
Risk plot uses a single risk line – risk plot chart displays a line to indicate the initial risk. Select the chart line style from the list, for example, “Asset risk tolerance line”. Here is an example of a risk chart with a single line:
Risk plot uses areas to show risk – Each severity level is represented by a colored area in the chart. The tab changes as follows:
Select the appropriate chart line style for each risk level that you wish to show. Here is an example of a risk chart with all five areas:
19.
Select the Approvals tab. If analyses of this type are to be sent for approval, click Approvals are supported.
20.
To specify the approval routes available for analyses of this type, click Only the approval routes selected below are available. The table lists routes that approve safety objects. Select one or more routes.
Select the Sites tab to see which sites support analysis approval settings.
21.
Select the Description tab to enter more information.
The Status tab displays the type’s active status and details about the last status change.
You can view the history of the analysis type. The History tab displays changes to the type and includes the user responsible for the change, the date, and the before and after values of the property that changed.
Tip: Click Where Used at the bottom of the Asset Analysis Type window when you wish to see lists of the prioritization analyses that use the type.
22.
When you have finished, click OK to close the window. The analysis type appears in the table.