|
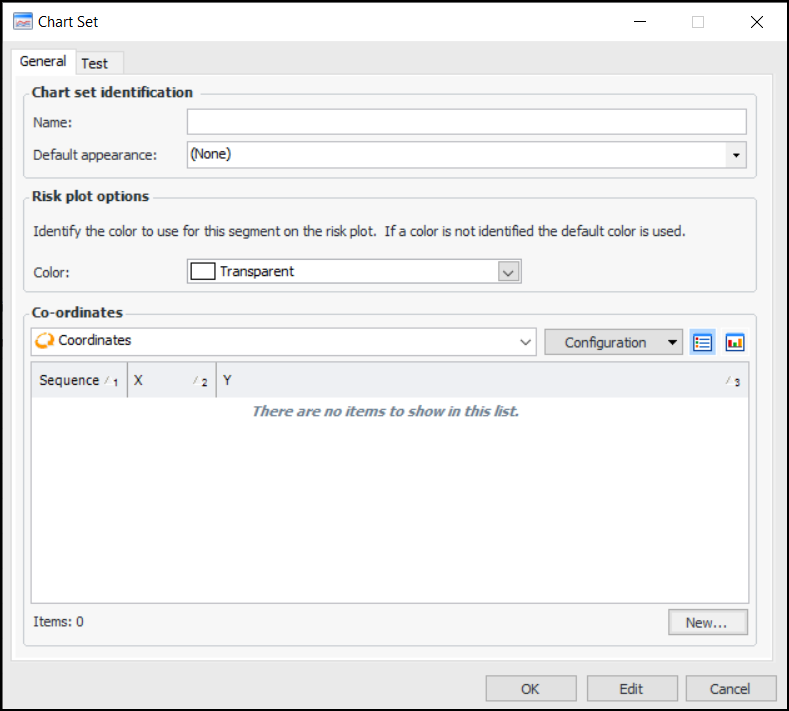
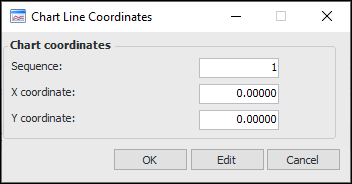
Setting up Chart Target Lines
To Set up a Chart Target Line
1. From the Site window, select the Inspection Management view, the Settings tab, and then the Indicators tab. Select the Indicator Settings node in the tree.Tip: You can also click the Administration menu, Inspection Management Settings, and then Indicator Management. The Indicator Settings window appears.
2. Select the Charts tab. This tab shows all of the chart target lines defined for the enterprise.
3. Click New. The Chart Set dialog appears:
5. In the Default appearance list, select a line style.
6. For each coordinate on the line, click New. The Chart Line Coordinates dialog appears.
8. In the X coordinate box, enter the number on the X axis (for example, probability) where the coordinate is positioned.
9. In the Y coordinate box, enter the number on Y axis (for example, severity) where the coordinate is positioned.
10. Click OK. The coordinate is added to the Chart Set dialog.Tip: Select the Test tab to see an example of the line co-ordinates.
11. When you have added all of the coordinates, click OK. The chart line is added to the table.