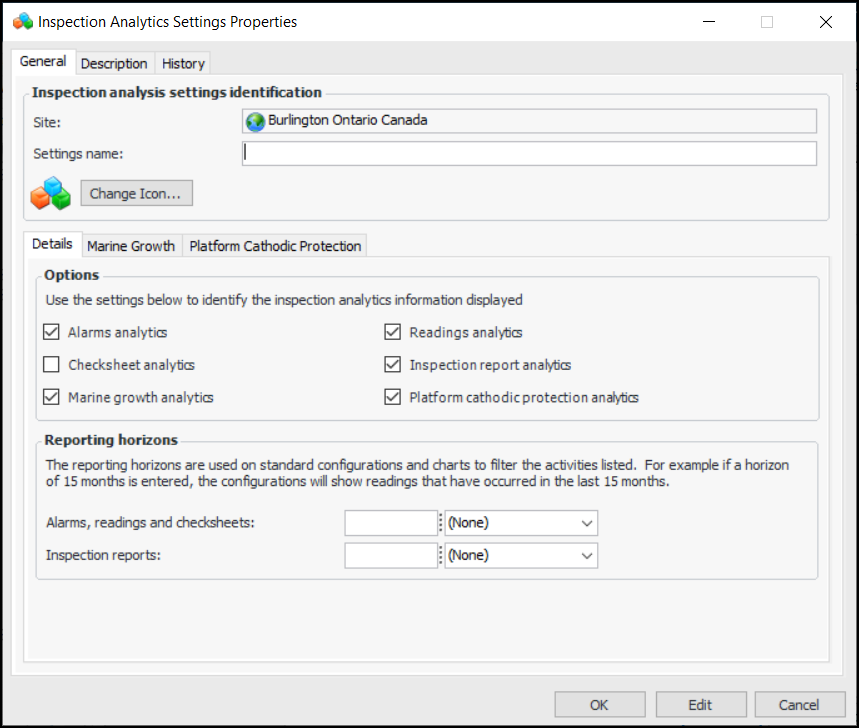
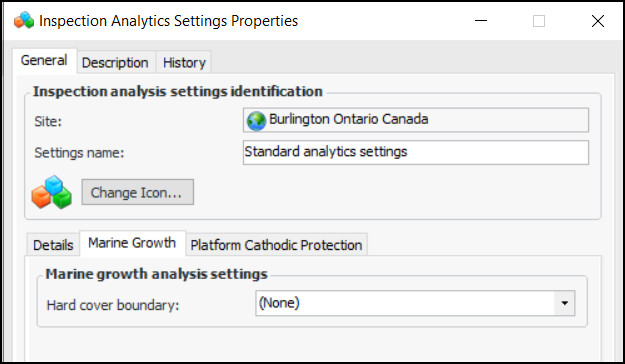
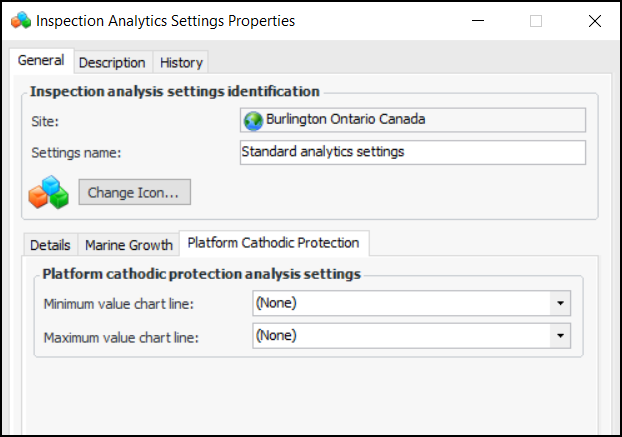
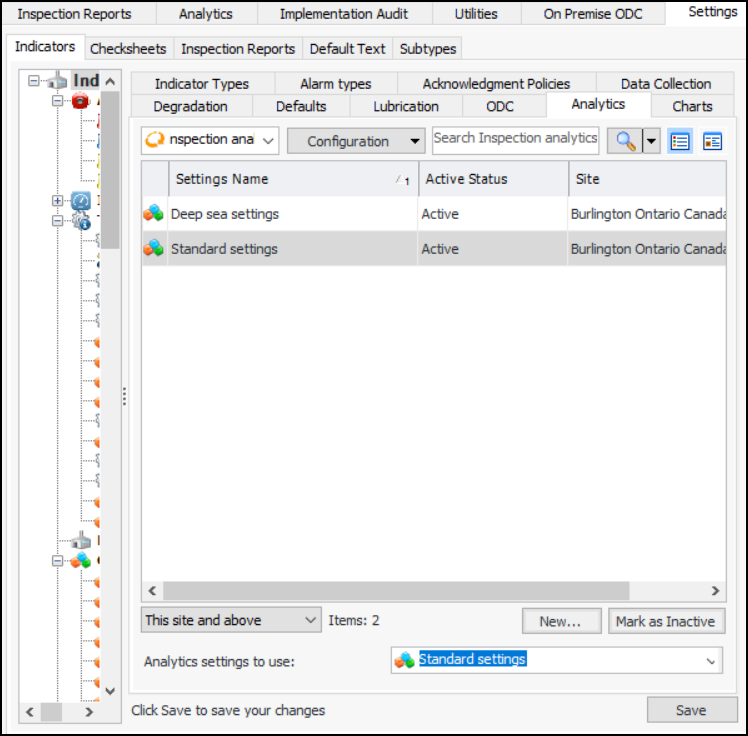
Setting up Inspection Analytics Settings

You can set up the Analytics tab in the Site window, Inspection Management view to display a variety of information, ranging from alarms, readings, and inspection reports to marine growth and platform cathodic protection. You can also specify the time period (in days, weeks, months, or years) for the data.
For related information, see Setting up Chart Target Lines.

To Set up Inspection Analytics Settings

1.
From the Site window, select the Inspection Management view, the Settings tab, and then the Indicators tab. Select the Indicator Settings node in the tree.
Tip: You can also click the Administration menu, Inspection Management Settings, and then Indicator Management. The Indicator Settings window appears.
2.
Select the Analytics tab. This tab shows all of the settings defined for this site and above.
3.
Click New. The Inspection Analytics Settings dialog appears:
4.
5.
6.
7.
If appropriate, select the Marine Growth tab:
8.
In the Hard cover boundary list, select a chart target line.
9.
If appropriate, select the Platform Cathodic Protection tab:
10.
11.
Click OK to save the settings and close the dialog. The settings are added to the tab.
12.
Click Edit to open the site for editing. The Edit button changes to Save.
13.
Select the settings in the Analytics settings to use list:
14.
Click Save.