|
|


Setting Risk Analysis Options for Analysis Types
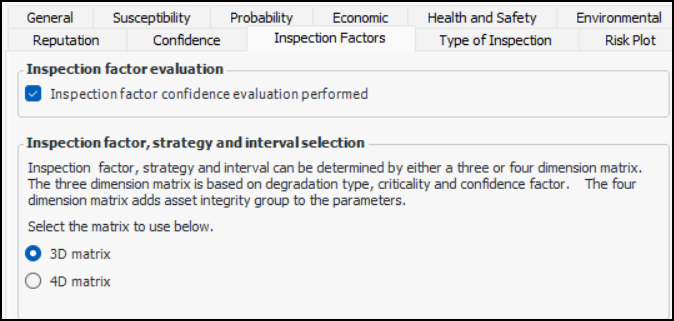
This topic explains how to set the risk analysis options for a type that supports risk analysis: MTA2, RCM2, RBI, SIF, and HAZOP. For information about setting up general, analysis, and audit report options, see Setting up Analysis Types. To set failure mode options, see Setting Failure Mode Options for Analysis Types.
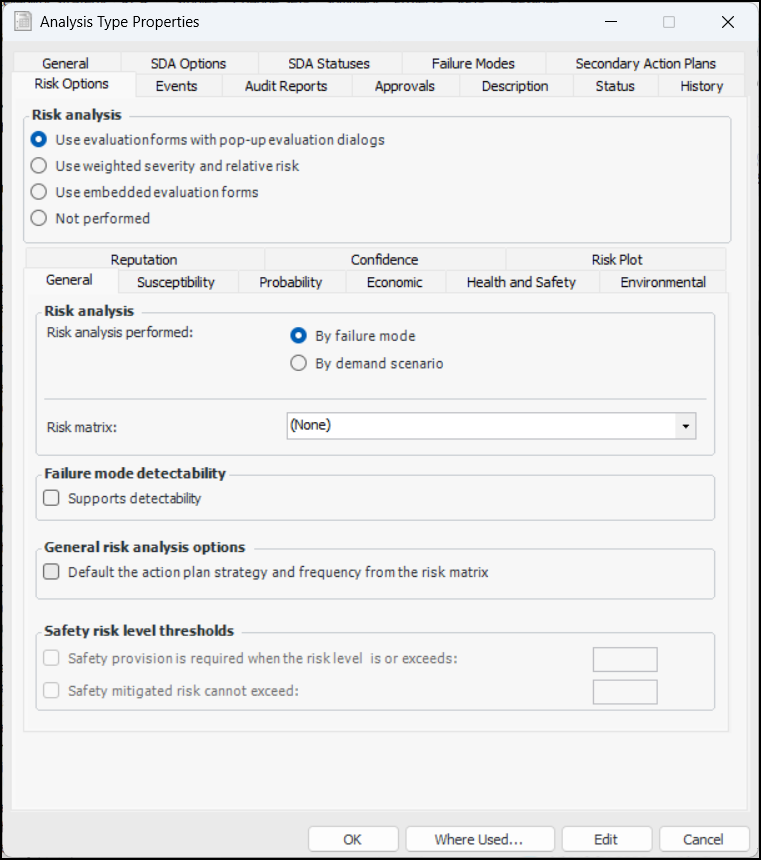
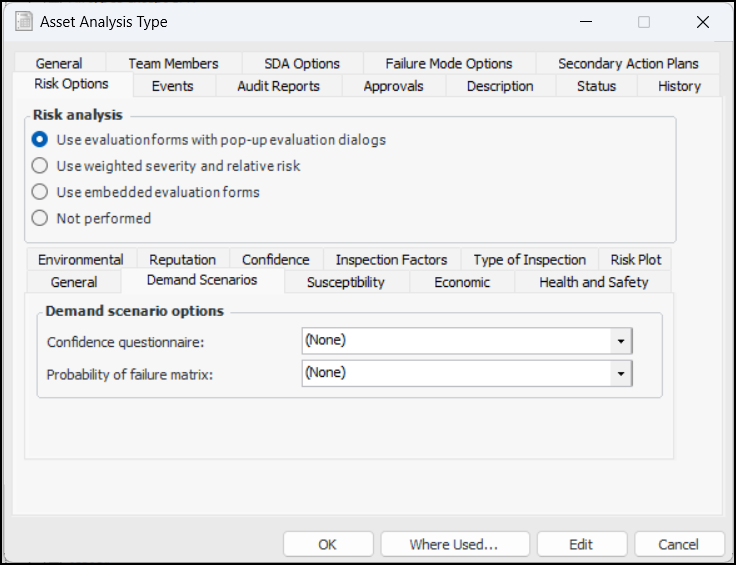
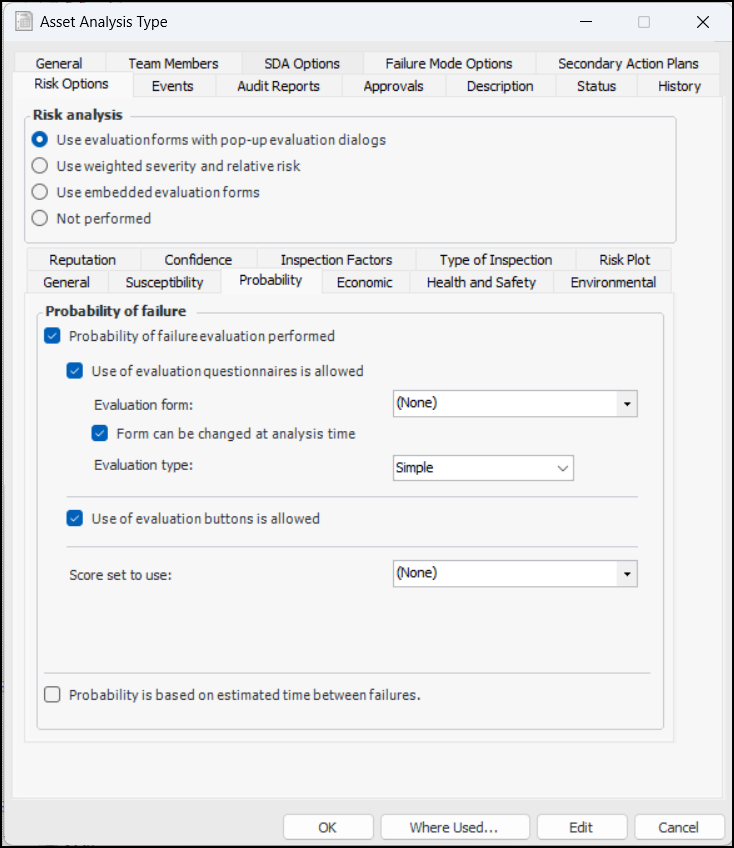
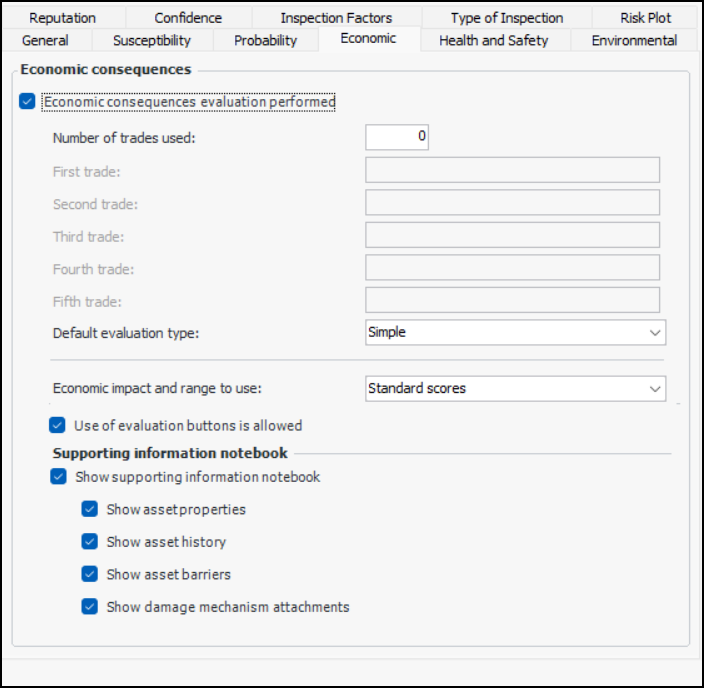
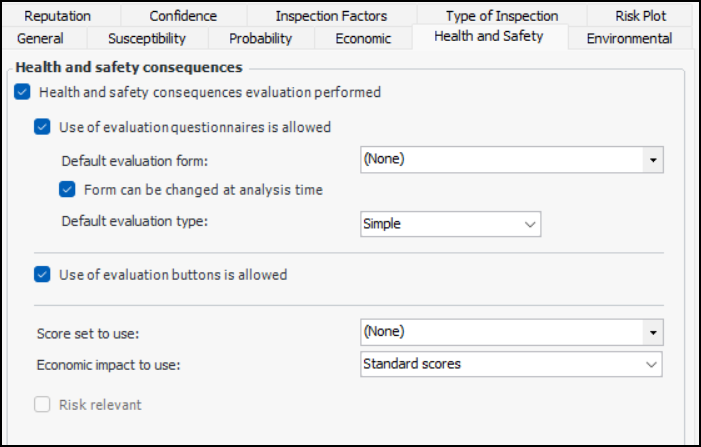
To Set Options for Using Pop-up Evaluation Forms
Note: This section pertains to MTA2, RCM2, and RBI analysis. For information about setting risk options for SIF and HAZOP analyses, see To Set Options for Using Embedded Evaluation Forms.
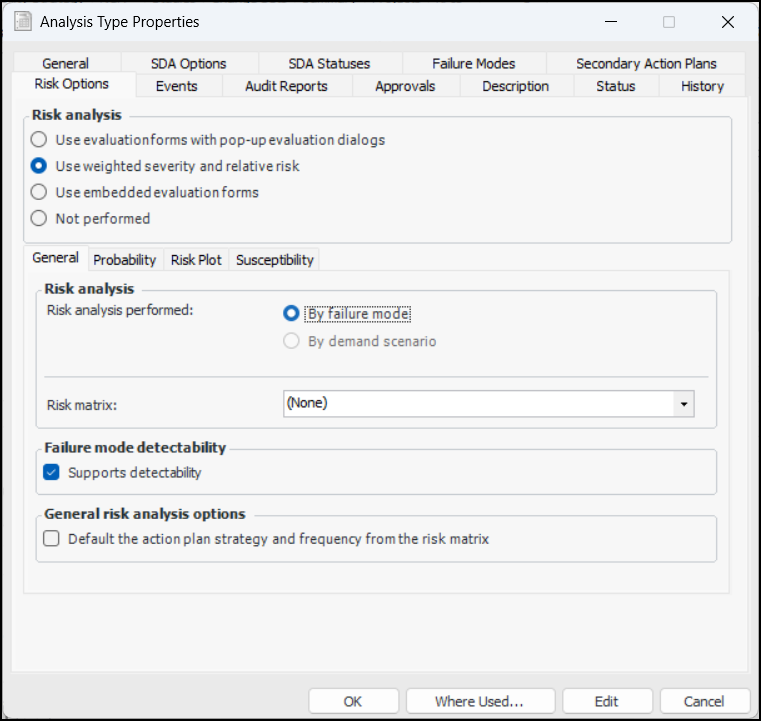
To Set Options for Using Weighted Severity and Relative Risk
Note: This section pertains to MTA2, RCM2, and RBI analysis. For information about setting risk options for SIF and HAZOP analyses, see To Set Options for Using Embedded Evaluation Forms.
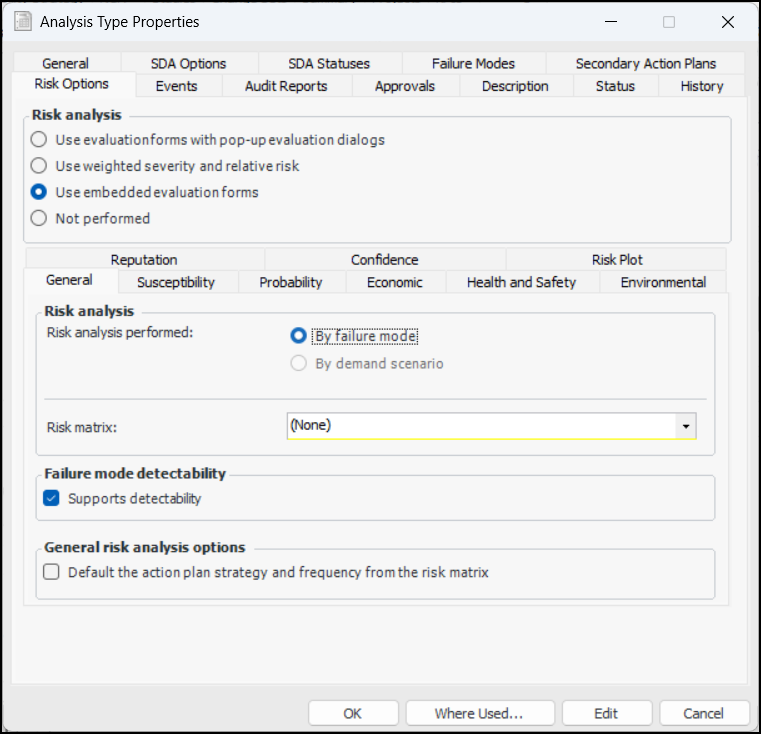
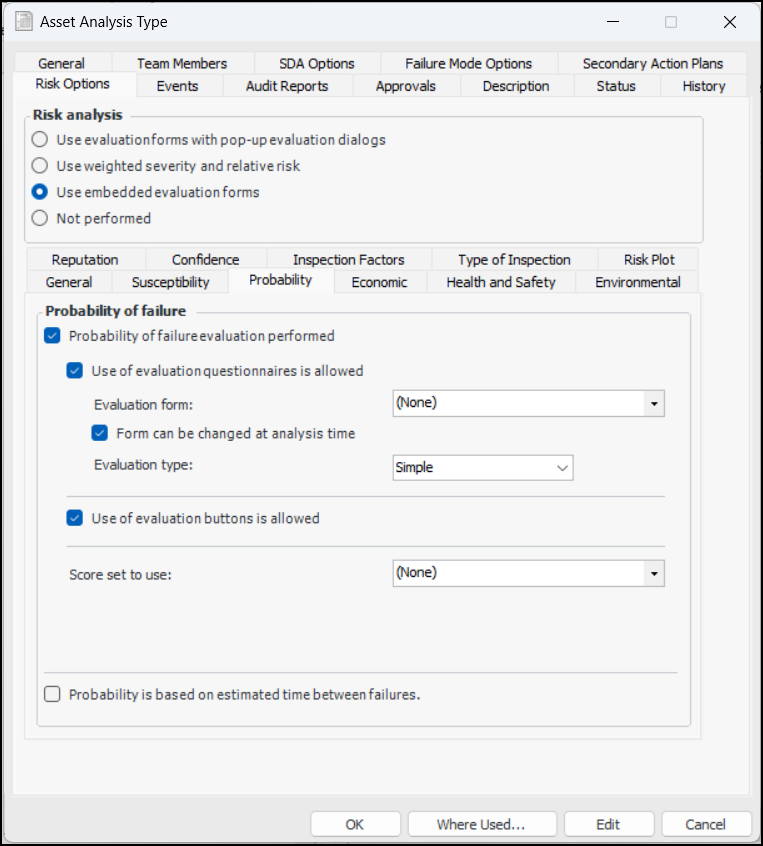
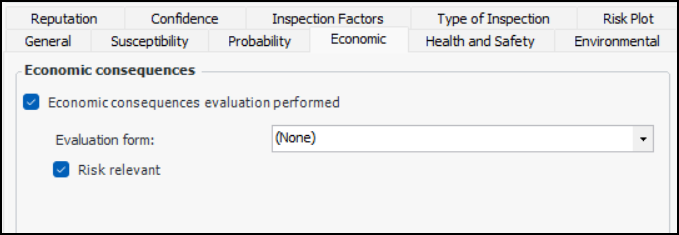
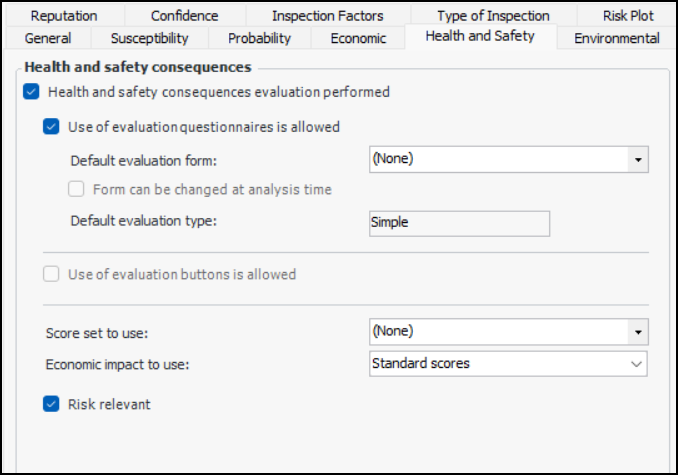
To Set Options for Using Embedded Evaluation Forms