Setting up Evaluations with the Category Answer Matrix

When setting up consequence severity evaluations for risk analysis, you can use the category answer matrix with simple evaluations. You can define questions for as many as four categories, show examples for each category, and select probabilities to use in the matrix. APM generates a matrix that takes into account the categories, category questions, and probabilities. For each matrix entry, you can select a severity ranking and safety integrity level, if applicable. This type of evaluation must be used for SIF analysis and can also be used to design evaluations for other analysis types.
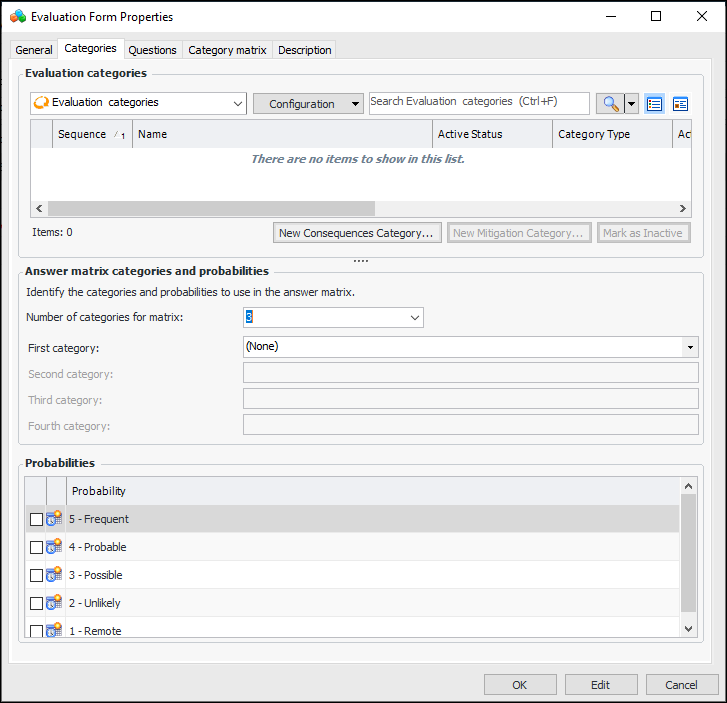
The category answer matrix is only supported for simple evaluations with one level of questions. Evaluations must be presented as embedded forms, meaning that the user opens the Maintenance Action Plan window, selects the Risk tab, and then selects options. This choice can be set in the risk options of the analysis, analysis type, or asset type.
You can use the category answer matrix when creating these types of evaluations:
Note: When embedded forms are specified for a strategy development analysis, you must set up an economic evaluation using a category answer matrix. When pop-up questionnaires (rather than embedded forms) are specified for an analysis, APM provides simple and detailed worksheets to perform the evaluation.
This topic provides background information and explains how to set up an evaluation that analysts can use to assess the severity of consequences. Information includes:

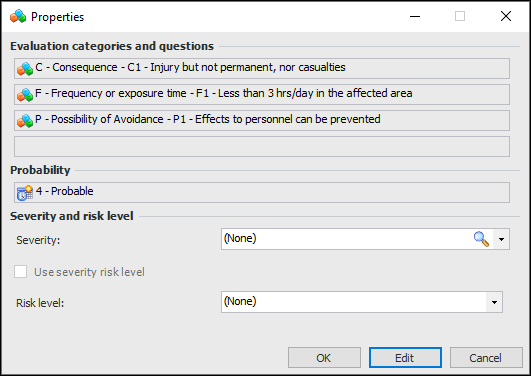
Anatomy of an Evaluation
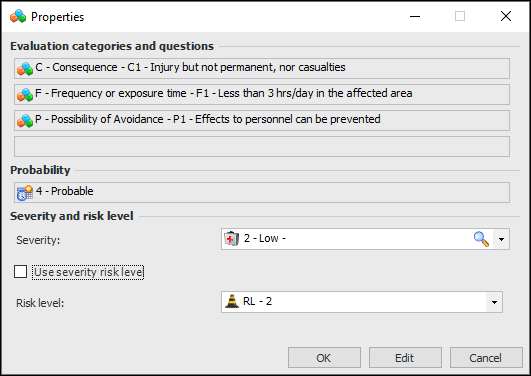
When setting up the evaluation, you will define as many as four consequence categories, for example, safety consequence, frequency or exposure time, and possibility of avoidance. For each category, create questions or impact statements. Assign a ranking number to each question to indicate the severity of the effect. Typically, the larger the number, the greater the severity. Here are examples of the safety consequence and its rankings:
Each category has its own questions and rankings.
After defining all of the categories, select a maximum of four to include in the evaluation. You will also select the probabilities to use in the matrix, for example, High, Medium, Low.
When you generate the category matrix, APM creates one entry for each combination of category question and probability. For example, an evaluation with three probabilities and three categories each with three questions will have 72 entries.
Assign a severity to each entry, for example, from Negligible to Severe. A severity’s definition includes its severity score, which is used to calculate the evaluations’ severity value. Each entry is also assigned a risk level for use in SIF analyses. Here is an example of an entry:
As an analyst goes through the evaluation, first selecting the probability of failure and then selecting categories and statements, APM determines the severity for the evaluation. The severity is derived from the selected entry with the highest severity score. On SIF analyses, the risk level is determined in the same way.

Example Evaluation

In order to appear in the Maintenance Action Plan window, the evaluation must be selected in the risk options for the analysis, analysis type, or asset type. Evaluations that use the category answer matrix are presented as embedded forms, rather than pop-up online questionnaires. Here is an example of a Safety evaluation:
The analyst first clicks a Probability button or completes a probability questionnaire (if supported). The probability applies to all of the evaluations. In this example, there are Safety, Environmental, Reputation, and Economic evaluations.
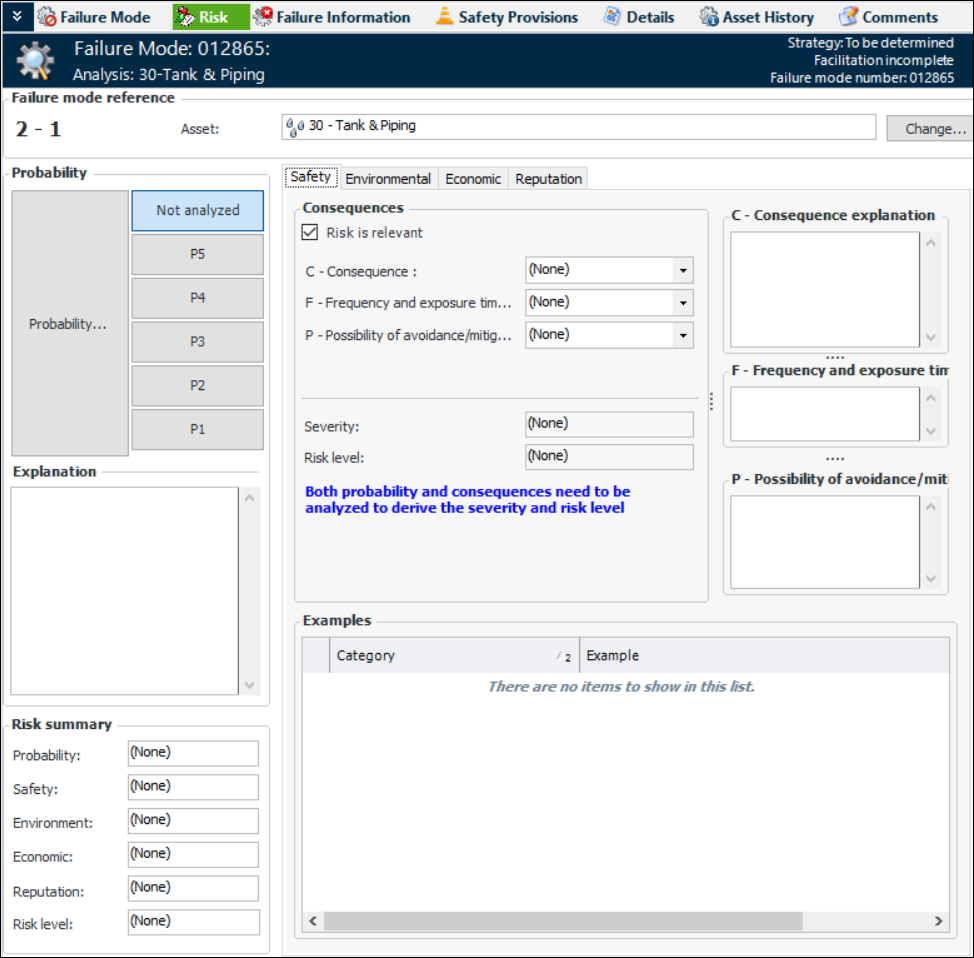
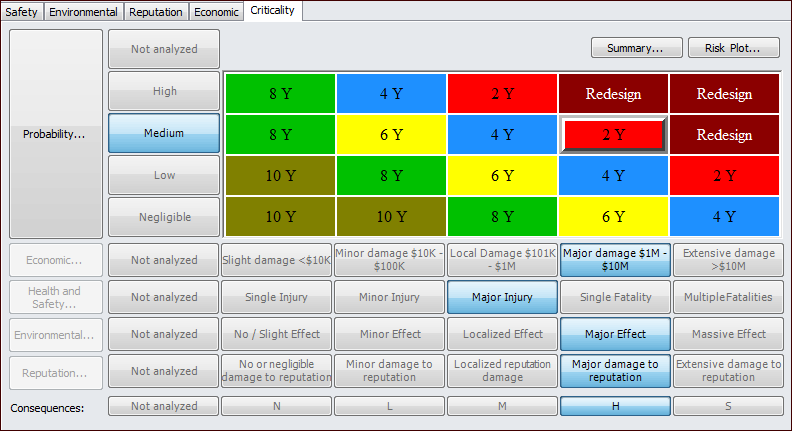
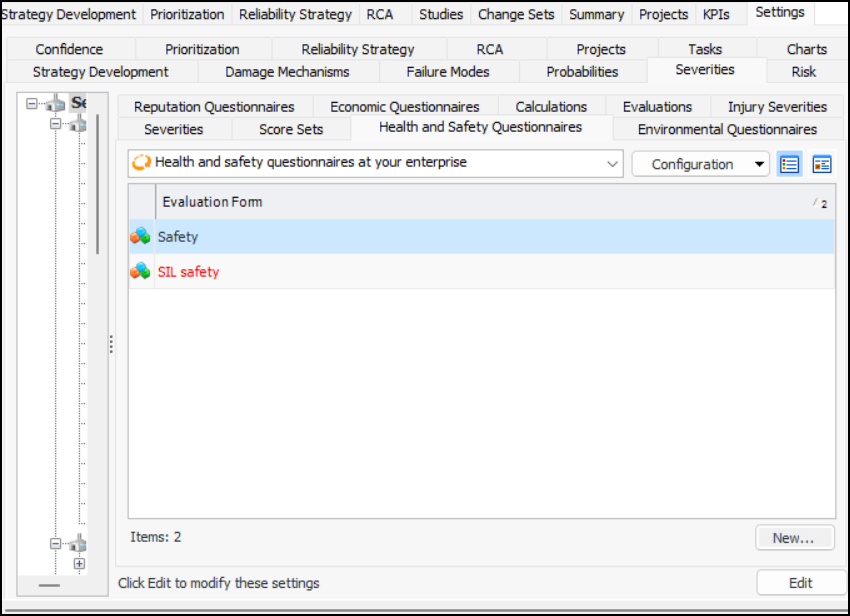
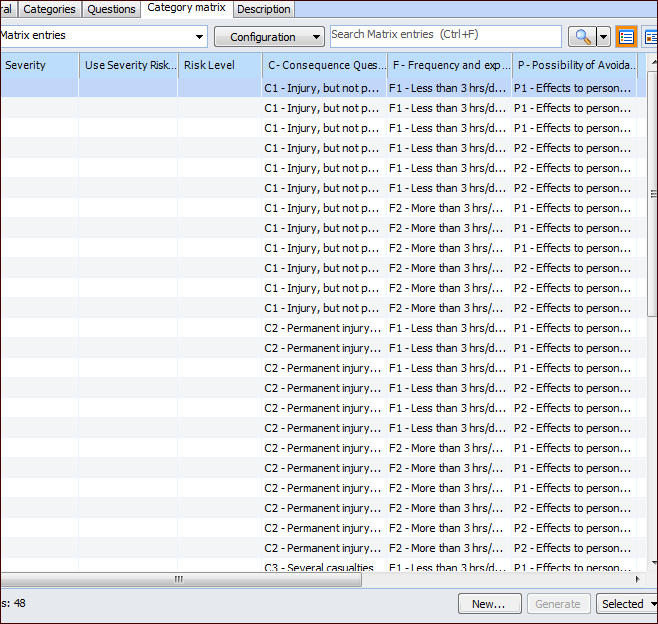
To complete the Safety evaluation, the analyst selects options for each consequence category (for example, Frequency or exposure time) and enters comments. The selection with the highest severity score determines the severity assigned to the evaluation, which is shown in the Severity box. The risk level for that entry is shown in the Risk level box and the Safety box in the Risk summary area.
In the Risk summary area, the Risk level box shows the overall risk level for the failure mode, which is the highest level assigned to any of the evaluations.
The analyst can select the Criticality tab to view a risk matrix summarizing the severities of the evaluations. For example:

To Set up an Evaluation with a Category Answer Matrix

1.
On the site’s Strategy Development view, select the Settings tab, the Severities tab, and the Severities settings node in the tree.
Tip: You can also select the site’s Administration menu, Strategy Development Settings, Risk Analysis and then Severities. The Strategy Development - Severities Settings dialog appears.
2.
Select the Questionnaires tab for the type of evaluation you are creating, for example, Health and Safety Questionnaires.
3.
Click New. The Evaluation Form window appears.
4.
5.
On the Details tab, select Only simple evaluations are supported.
6.
Select Category answer matrix. This option is only available when Only simple evaluations are supported is selected. It is not available for probability or confidence evaluations.
Now you can add consequence categories, as explained next.

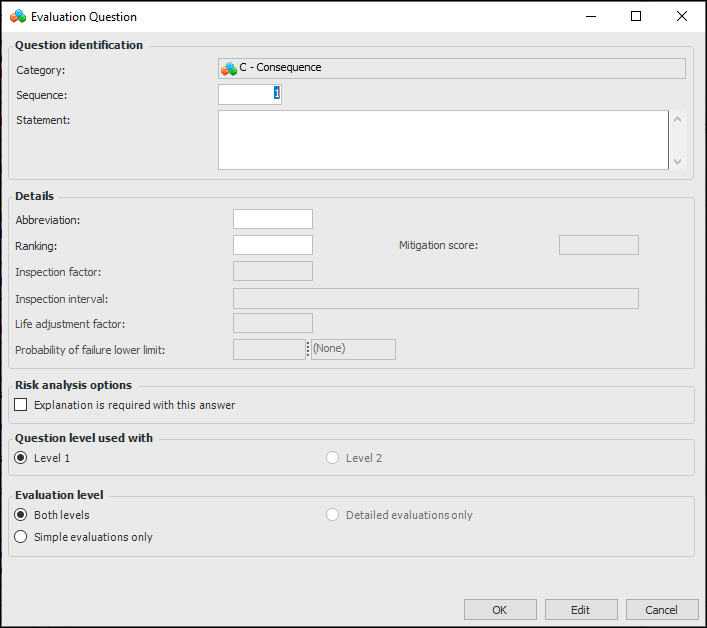
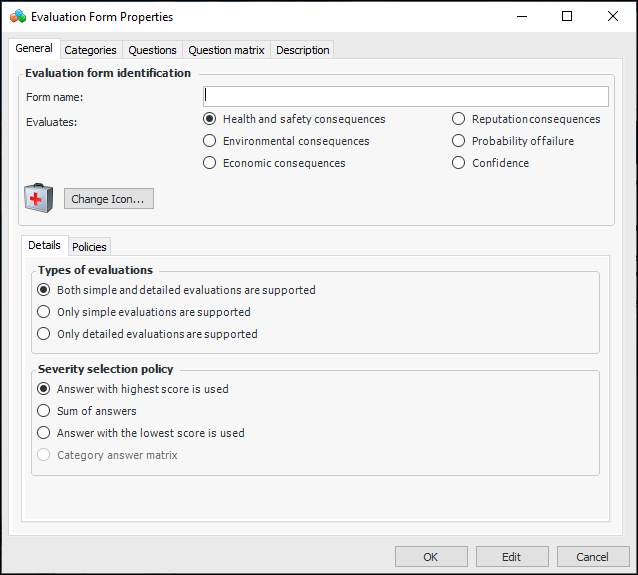
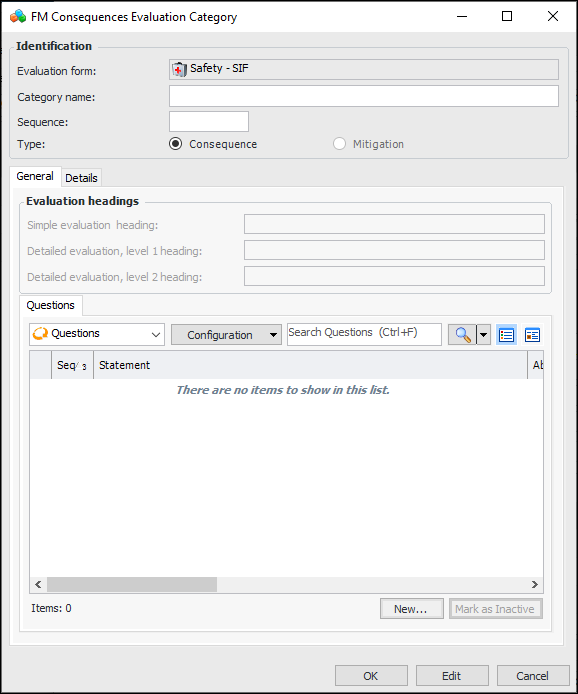
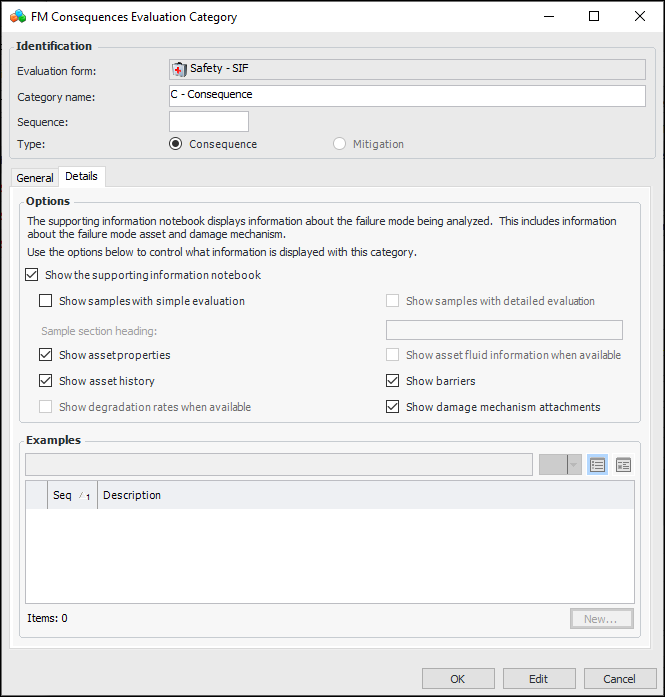
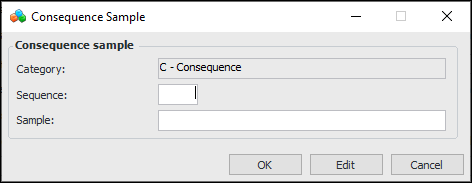
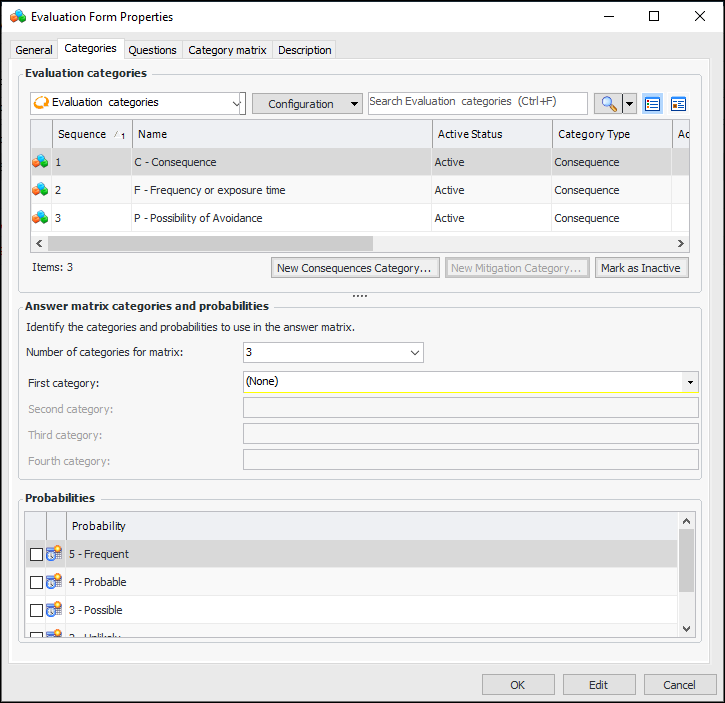
To Create Categories and Questions

1.
2.
Click New Consequences Category. The FM Consequences Evaluation Category window appears.
3.
4.
Click New. The Evaluation Question window appears.
5.
6.
Click OK. The question is added to the Questions tab.
7.
Repeat steps 4 to 6 for each of the questions in the category.
8.
Select the Details tab to set supporting information options. For example:
9.
The heading that appears at the top of the Samples tab for this category in the questionnaire.
When this option is selected, the supporting information notebook contains the Asset Properties tab. This tab provides the failure mode asset’s properties on several tabs.
When this option is selected, the supporting information notebook contains the History tab. This tab provides the failure mode asset’s checksheets, failures, work orders, and work requests.
When this option is selected, the supporting information notebook contains the Barriers tab. This tab lists the failure mode asset’s failure barriers.
When this option is selected, the supporting information notebook contains the Attachments tab. If the RBI failure mode was created from a damage mechanism, this tab lists the damage mechanism’s attachments.
10.
For each example, click New. The Consequence Sample dialog appears:
In the Sample box, enter the example. Click OK. The sample is added to the Examples table.
11.
Click OK. The category is added to the Evaluation categories table. For example:
Tip: While you are developing an evaluation, you can mark a category as inactive until it is ready to be used in risk analyses. On the Categories tab, select the category in the table and click Mark as Inactive. The Mark as Inactive window appears, where you can enter a comment. When you click OK, a confirmation message appears. Click OK. The category’s Active Status in the table is shown as “Inactive”. When you are ready, click Mark as Active to make the category available.
12.
In the Answer matrix categories and probabilities area, select the number of categories to use in the matrix. The maximum number is 4.
13.
14.
15.
16.
Select the Category Matrix tab. Click Generate. A matrix entry is created for each combination of category question and probability. For example:
17.
Each box in the Evaluation categories and questions area displays one of the categories that you selected on the Categories tab, along with one of the category’s questions. The Probability box displays one of the probabilities that you selected on the Categories tab.
18.
19.
Click OK to save and close the entry.
20.
Select the Description tab to enter additional information.
21.
Click OK. The form is added to the Questionnaires tab.
Note: When you have set up the evaluation, you can assign it to analysis types, asset types, and the risk options in individual analyses. For more information, see: