|
|


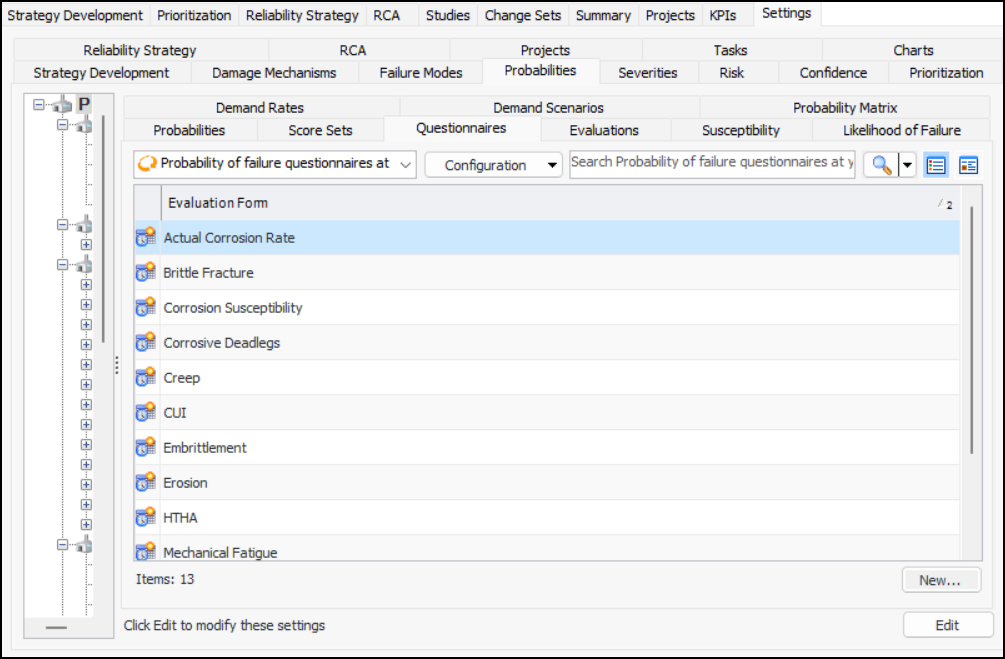
Setting up Probability of Failure Questionnaires
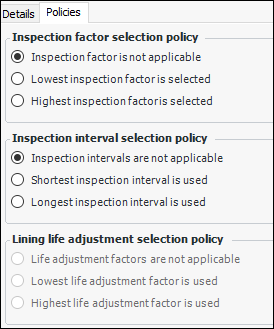
You can then set probability evaluation options for each of the analysis types. For example, for RBI analyses, you can specify that probability can be based on estimated time between failures (ETBF) or completed evaluation forms. You can make both of these options available so that analysts can use one or the other based on the requirements of a particular failure mode. For more information, see Setting Risk Analysis Options for Analysis Types.Example Questionnaire
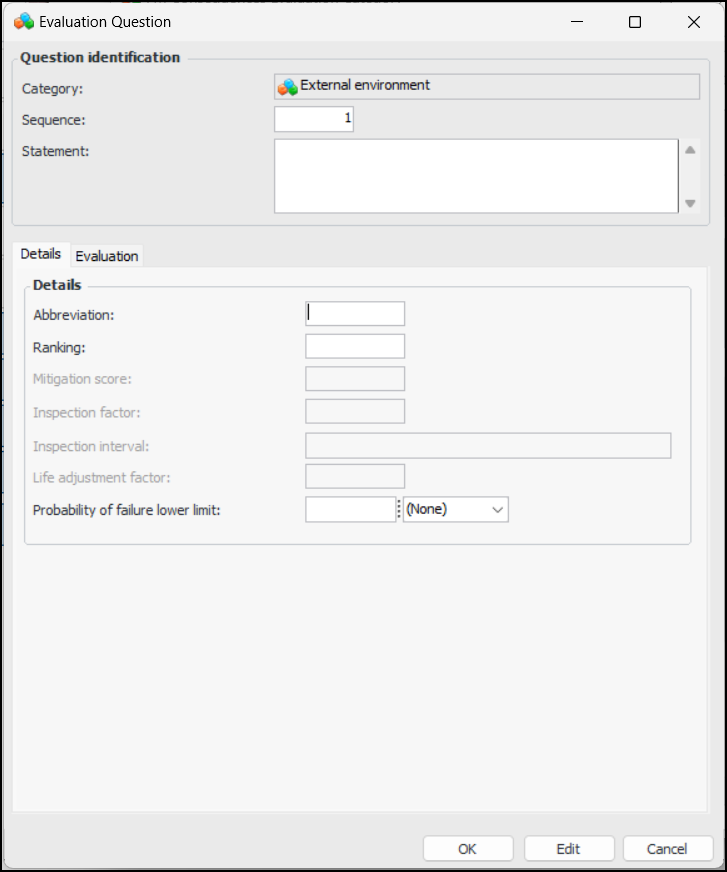
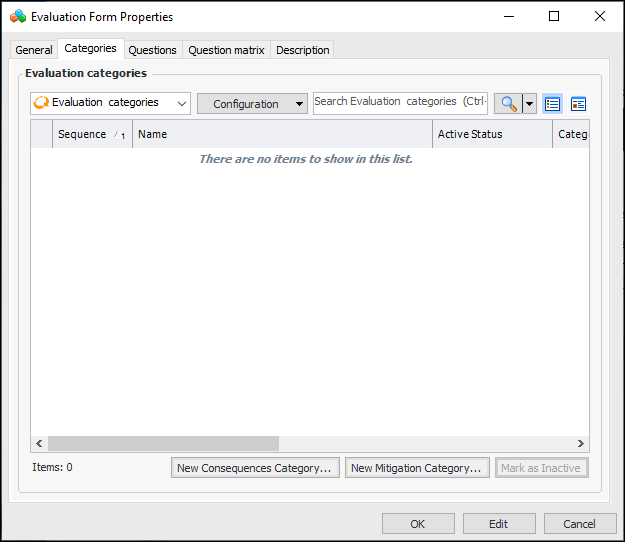
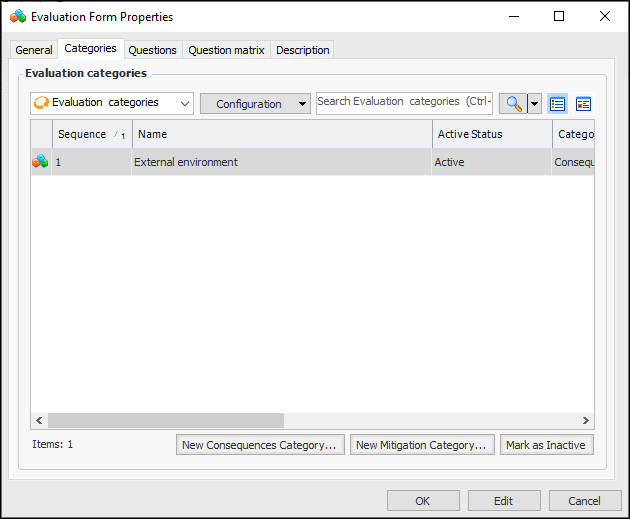
Categories
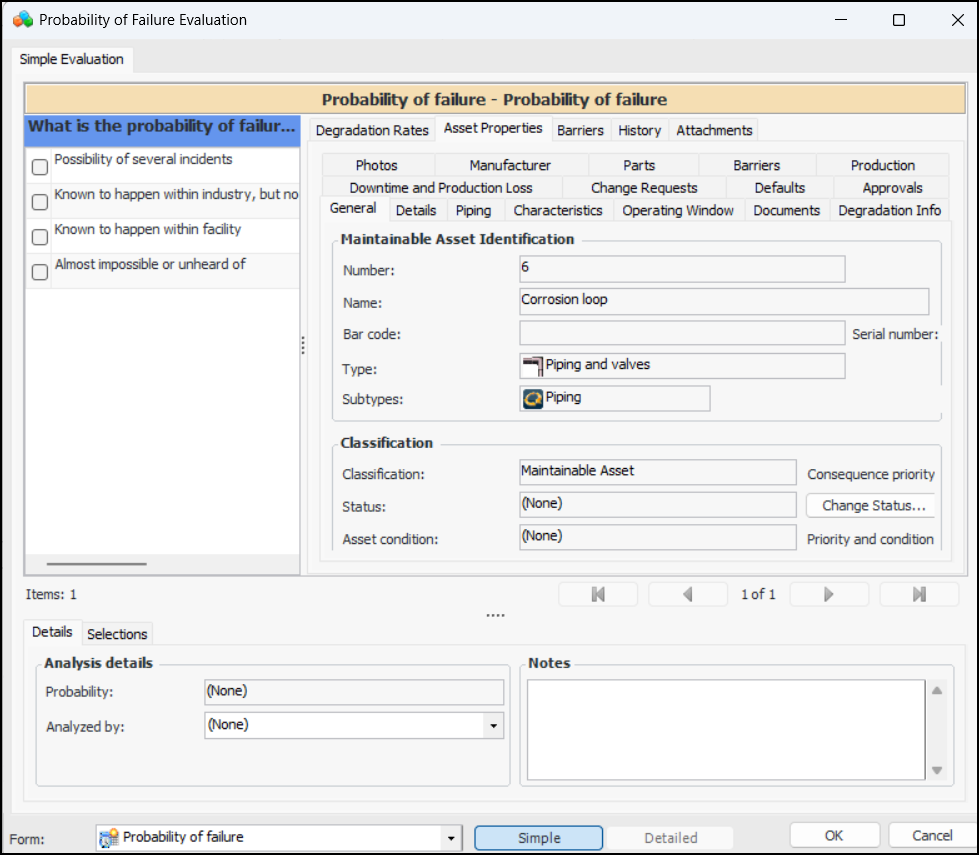
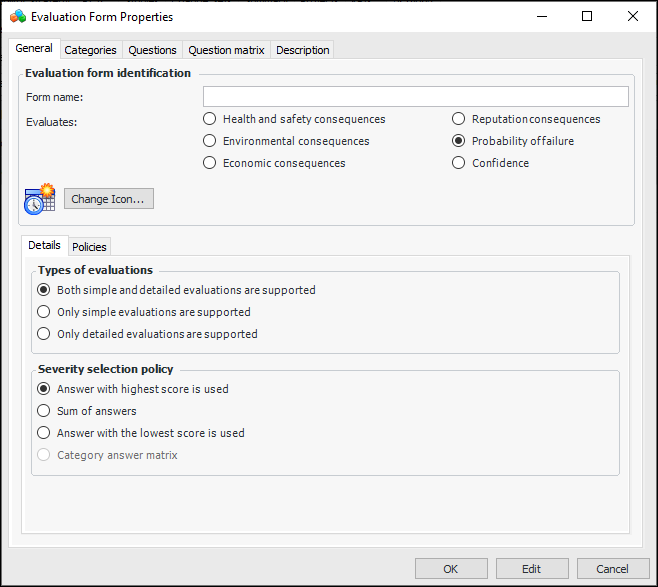
Simple and Detailed Evaluations
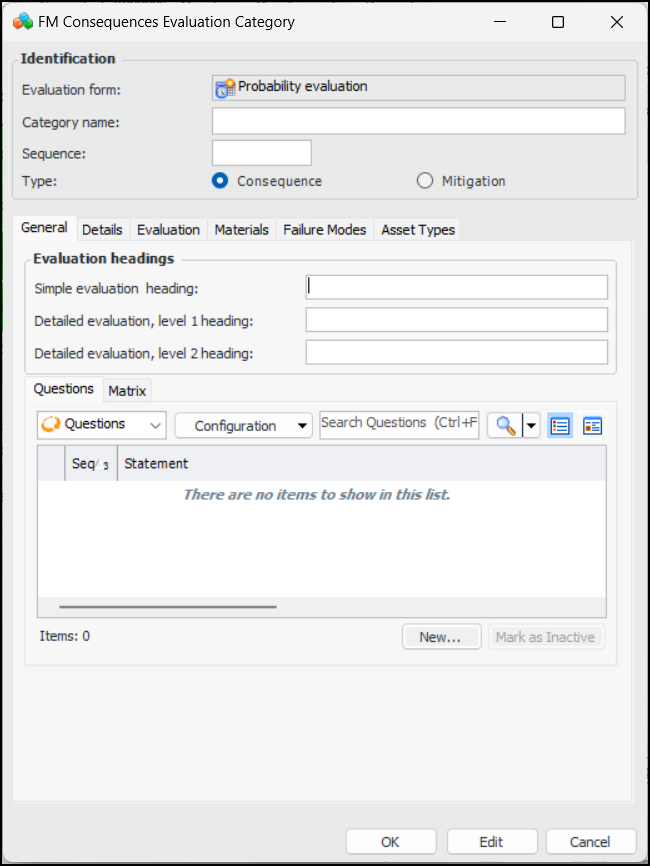
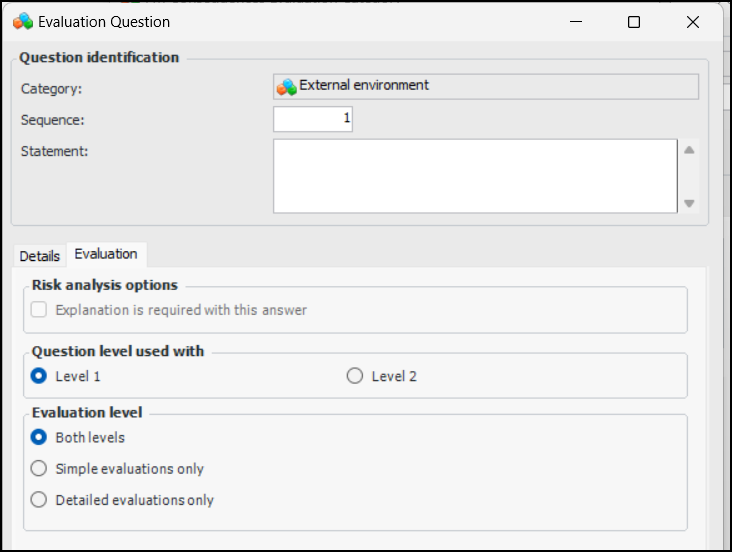
If different evaluation types have been defined in the form, the user can select Simple or Detailed, as required by the complexity of the failure mode. When designing a detailed form, you can specify whether it supports simple (one level of questions), detailed evaluations (one or two levels of questions), or both. When two levels of questions are defined, the first set of questions usually presents the problems and the second set presents the volume or size of the problem. Consequently, the two-level evaluation type is used most often for Health and Safety and Environmental evaluations.Probability Score Selection
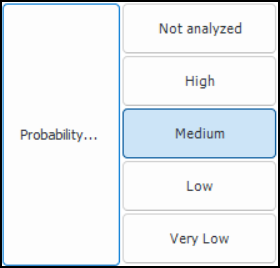
As the analyst moves through the evaluation, the Probability box displays the probability assigned to the selections. The probability is based on either the highest ranking answer or the sum of the scores for the answers. For example, when “highest ranking” is used, if options for three categories are selected in a simple evaluation, two of which have a result of “Negligible” and one with a result of “High”, the score for the evaluation as a whole will be “High”. When the “sum of scores” option is used, the numeric ranking of the questions are added and the corresponding probability is displayed. This will be the probability used in the risk analysis.Result of the Evaluation
The analyst can select the team member performing the evaluation from the Analyzed by list and provide additional information about the analysis in the Notes box. Notes are collected and available in several locations.When the analyst completes the evaluation and clicks OK, the evaluation form closes and the result (for example, high, medium, low, or negligible) is selected in the risk matrix. For example:Using Lookup Tables and Calculations
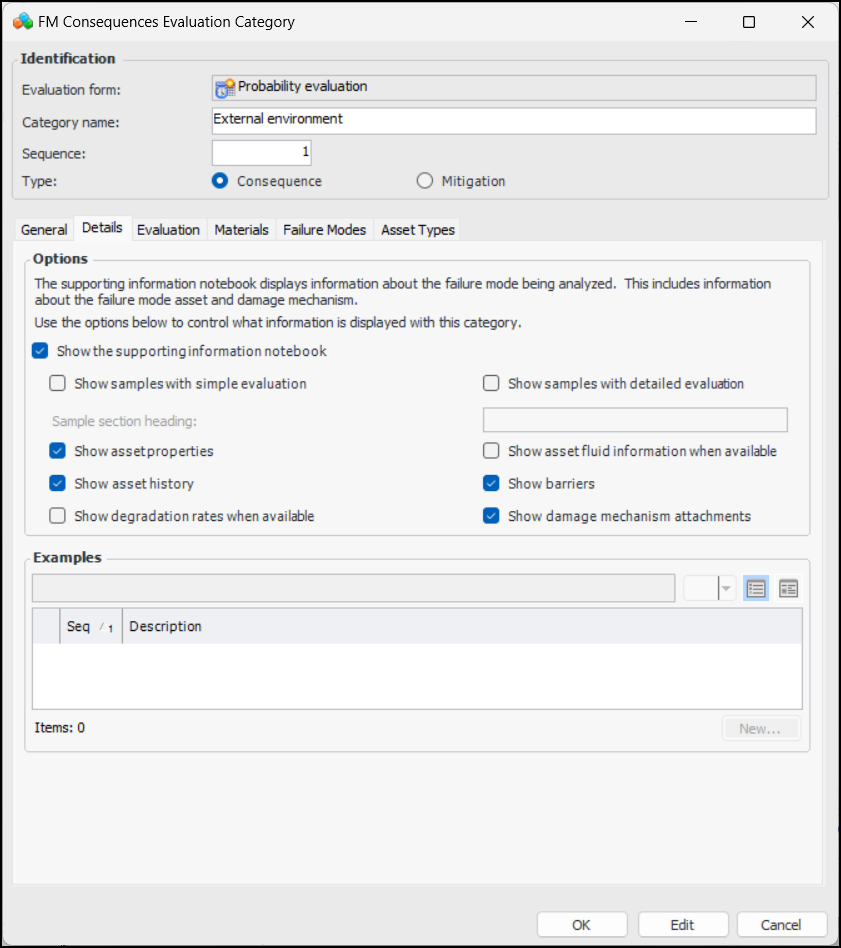
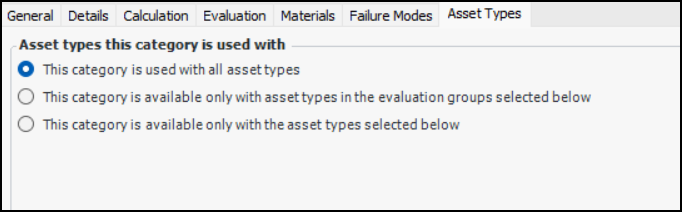
You can incorporate a lookup table and/or calculation in a category to automatically assess probability ranking. For example, use the degradation ratio lookup table to determine a ranking based on damage mechanism and actual degradation rate. For information, see Setting up Consequence Severity Evaluations to use Lookup Tables.Creating a Probability of Failure Questionnaire
To Set up a Probability of Failure Questionnaire
To Create Evaluation Categories and Questions