|
|


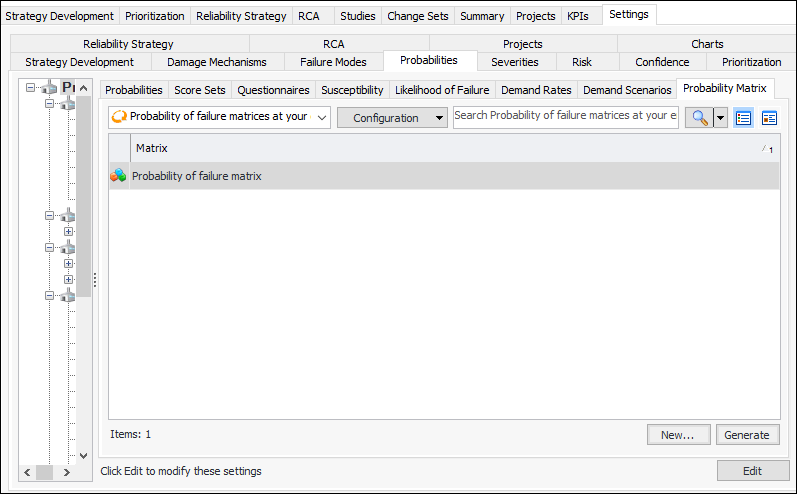
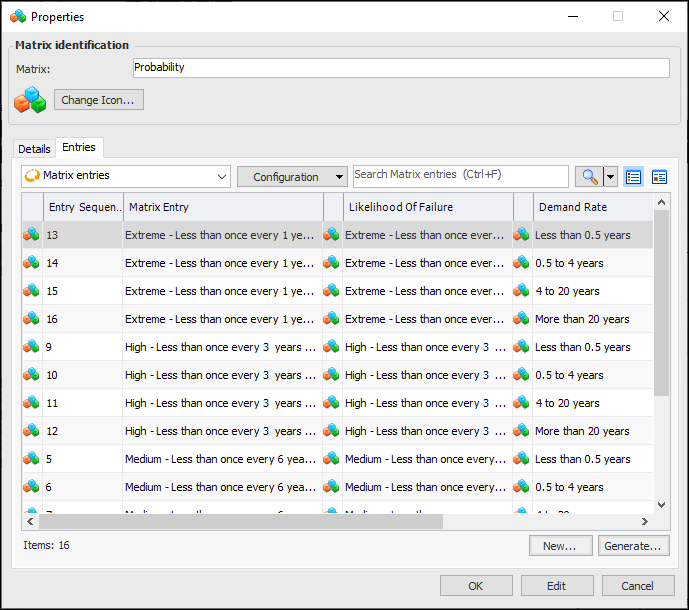
Setting up a Probability Matrix
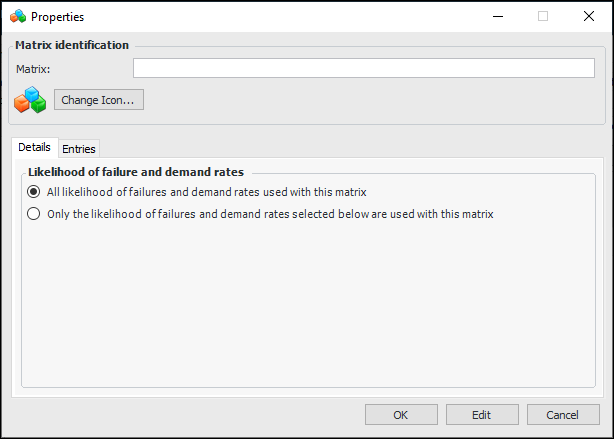
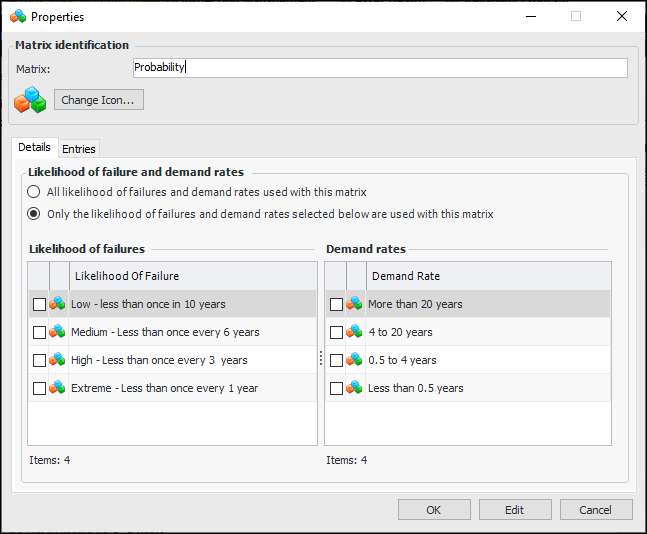
To Set up a Probability Matrix
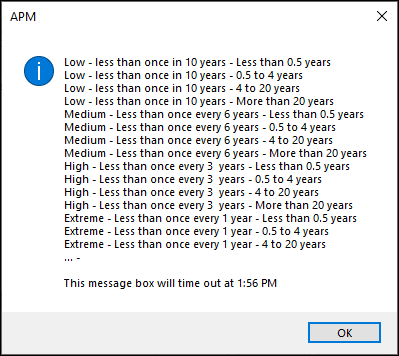
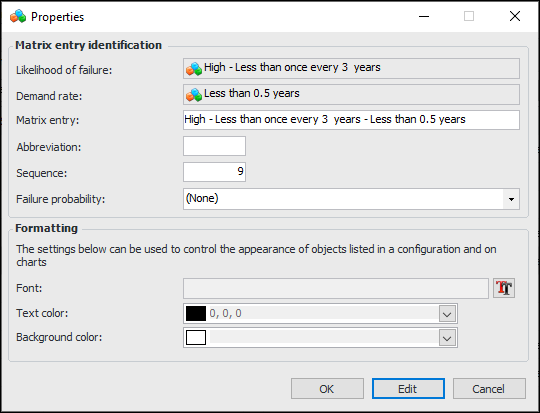
To Work with a Probability Matrix Entry