|
|


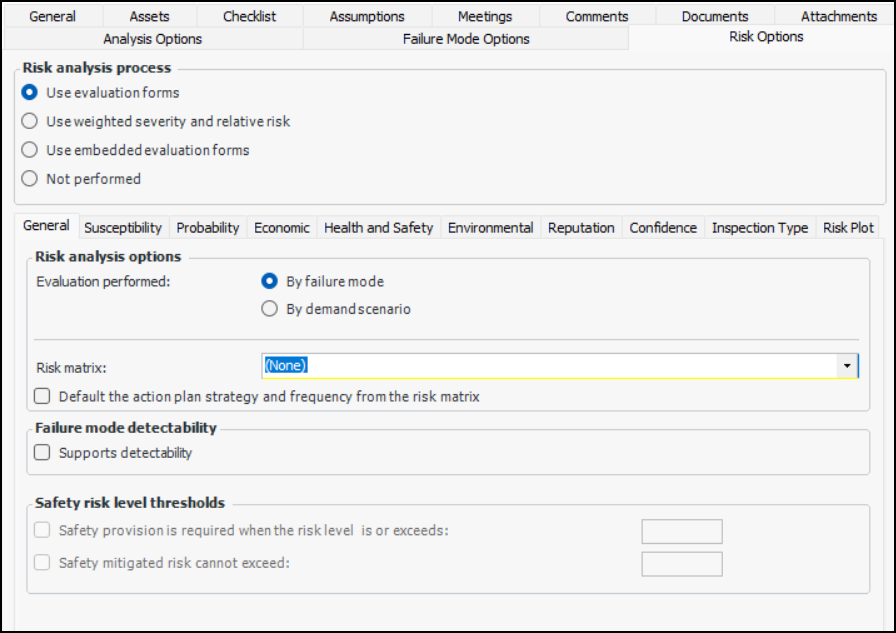
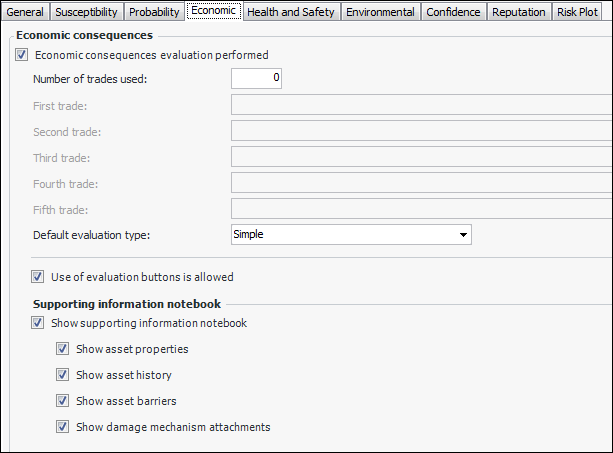
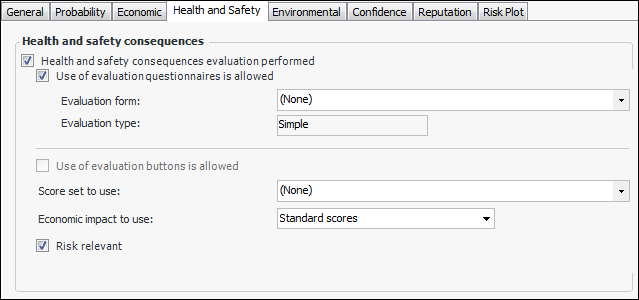
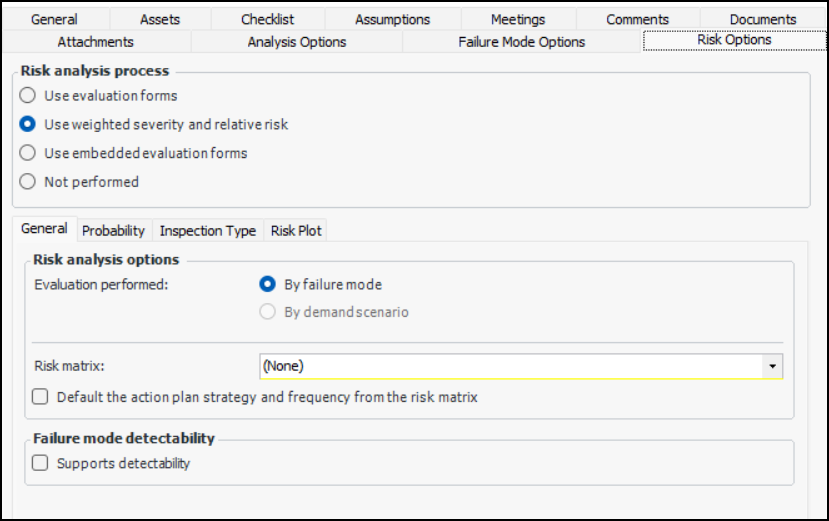
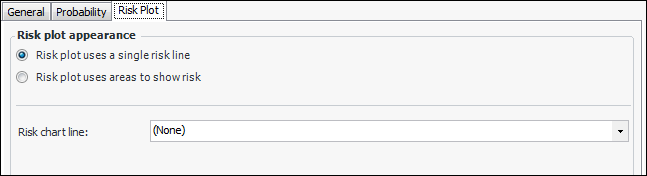
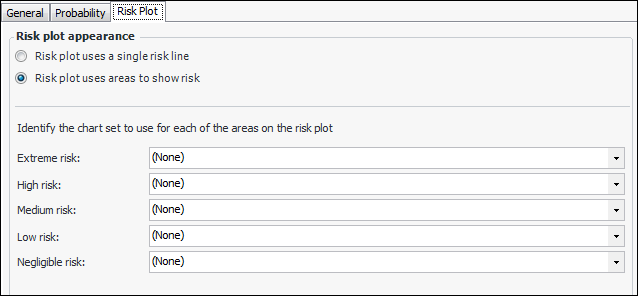
Setting Risk Analysis Options for an MTA2
To Set Options for Using Pop-up Evaluation Forms
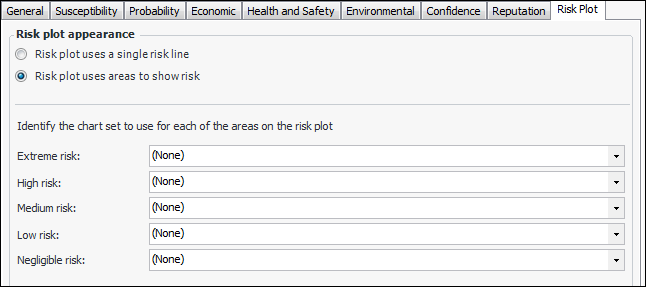
To Set Options for Using Weighted Severity and Relative Risk
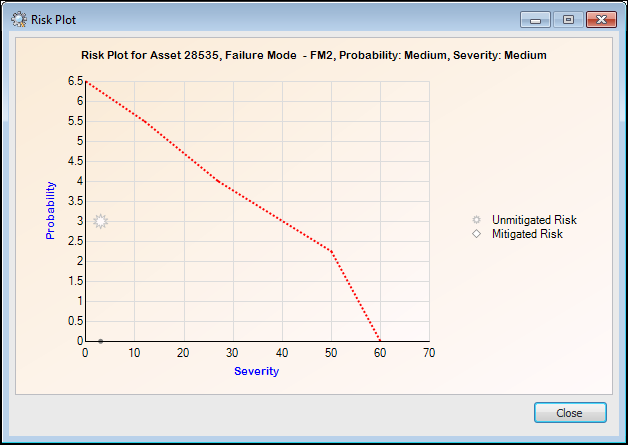
 is enabled.
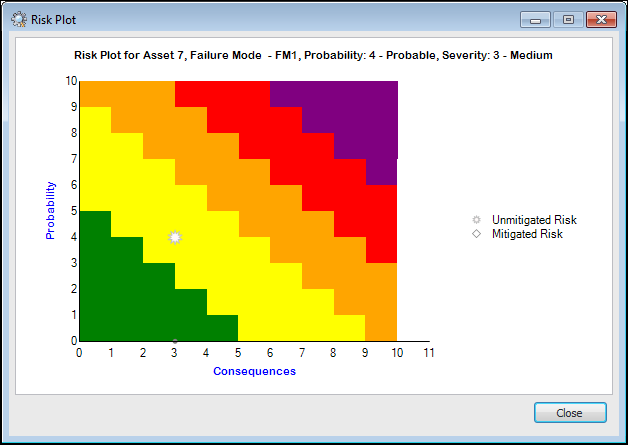