Degradation Indicators

Numeric indicators can be used to track degradation rates on assets. The degradation rate is used to determine the remaining life (time), remaining degradation allowance (for example, thickness), end-of-life date, and next inspection date for the asset indicator.
Degradation indicators can be created from the asset record’s Degradation Info tab, as well as from risk-based inspection analyses. They can also be created from scratch and designated as degradation indicators.
When a degradation indicator is created, it inherits the design degradation rate from the asset. The design rate can be overridden on the indicator when actual deterioration is measured. This is necessary because the degradation of a particular asset (for example, a pipe) can be measured in two or more locations, with each measurement location having different design specifications.
If the asset’s properties support lining or coating, you can set up degradation information for it. After you have set the initial values, the lining’s remaining life is tracked using the life adjustment factor, which is a portion of the lining’s by-design life span, for example, one tenth of its original estimated life. The factor is used to estimate the lining’s remaining life based on its condition at the time of inspection. Lining delays the date when the asset’s degradation starts. The calculation used to determine the asset’s end of life uses the lining’s end date in place of the asset’s degradation start date. That is, asset degradation begins when the lining no longer protects it.
You can select a representative degradation indicator for the asset to make it easier to show the current degradation values.

Degradation Information on Indicators

Indicators that track degradation information provide detailed information about the selected rate type, actual and expected rates, remaining life, and next inspection dates. Here is an example where the indicator rate is selected:
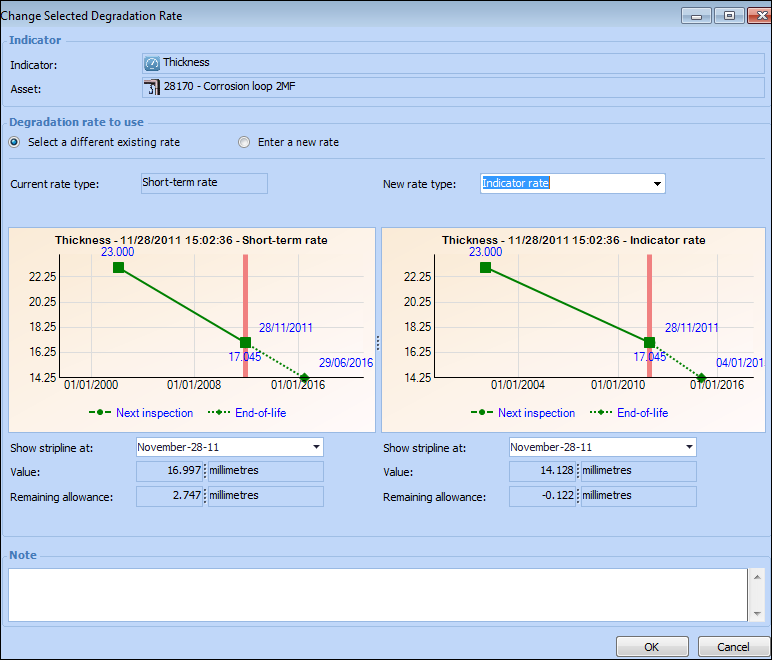
You can switch to a different rate type by clicking Change. The Change Selected Degradation Rate window provides charts to test the effect of the change before committing to it. For example:
When a new rate is selected, the chart, value, and remaining allowance change accordingly.
The indicator’s Readings view provides detailed information about history and expected next inspection and end-of-life values, comparisons of readings, as well as information about the current status, next reading, and alarm acknowledgments. The Degradation Dashboard view includes charts of relevant degradation information and rate analysis.
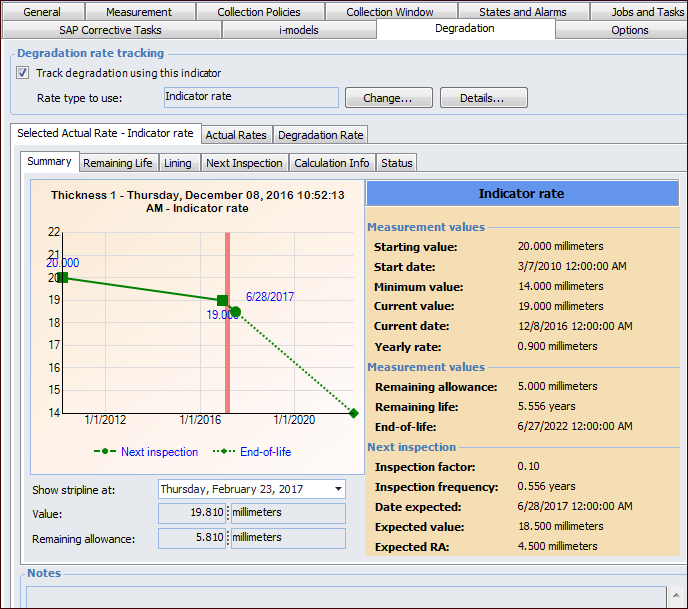
The Indicator Reading window’s Degradation tab displays rate comparisons, information about the selected degradation rate, all rates.
Extensive degradation information is also provided at the site level on the Inspection Management view, Readings tab.

Indicator Degradation Settings

Indicator settings include the Degradation tab, where you can set options for the site:

Degradation Settings on Indicator Type

When setting up indicator types for degradation tracking, you can specify the calculations to use for determining degradation rates (short-term, long-term, custom) and the selection policy for rates.
Because multiple rates can be calculated, the policy determines how the rate to use is selected. Either the rate is always set manually (fixed) or it is set automatically (variable) whenever rates are calculated. If the policy setting is “variable”, you can specify whether the fastest or slowest rate of degradation is selected.
When measurement points are included in the indicator, you can set the policy to determine how the degradation rate is calculated. Either the aggregate reading value is used, or the degradation rate from the measurement point that has degraded the most is used.