|
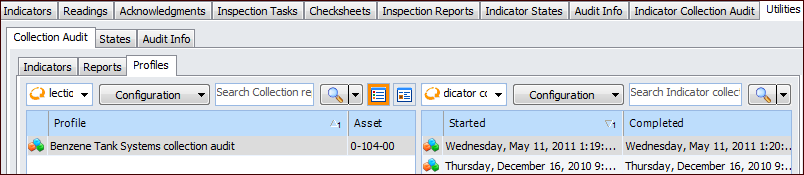
Working With Indicator Collection Audit Reports
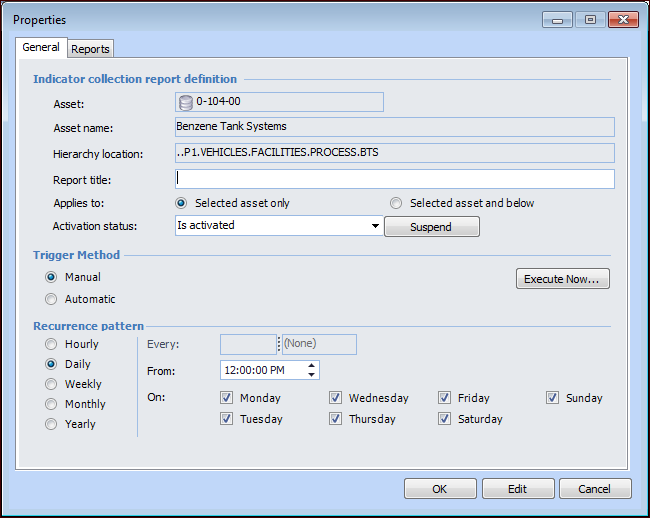
To Create an Indicator Collection Report Profile for an Asset
1.
2. Select the Collection Audit tab and then the Profiles tab. This tab lists existing profiles and the selected profile’s execution history. For example:
3. Click New at the bottom of the Profile table. The Properties dialog for the indicator collection audit report profile appears.
6. When you are ready to generate the report, select “Is activated” in the Activation status list. When the profile has this status, it is available for report generation, either manually or at scheduled intervals. When the status is “Is suspended”, the profile is not available.Tip: If the profile is suspended, you can also click Activate. A message appears asking you to confirm that the profile is available for use. Click Yes.The Activate button changes to Suspend. When you wish to make the profile unavailable, click Suspend.
• Manual – The report can only be generated by clicking the Execute button. See To Manually Execute a Report.
• Automatic – The report is generated at intervals according to the recurrence pattern defined for it. For information about setting the interval, see Defining Recurrence Patterns.A scheduled action must be set up to run the Generate Indicator Collection Audits method. See Creating a Scheduled Action.To Manually Execute a Report
1. In the Asset window, select the Inspection Management view, Utilities tab, Collection Audit tab, and then the Profiles tab.
2. Select the profile and click Execute.Note: The triggering method in the report profile must specify Manual and the profile must be activated.Tip: You can also open the profile and click Execute Now in the Indicator Collection Report Profile dialog.
3. A confirmation message appears, warning you that the process might take several minutes. Click Yes. When the process is complete, the report is listed on the Profiles tab in the right-hand table.
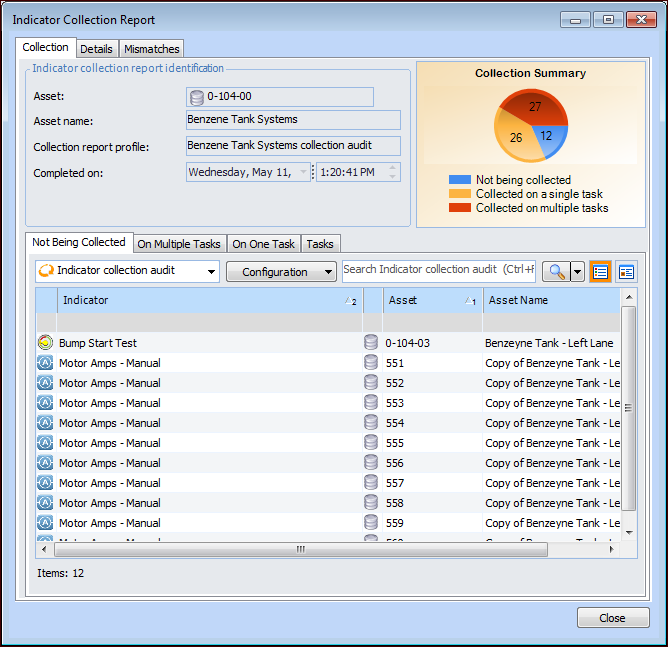
To Work with an Indicator Collection Report
1. In the Asset window, select the Inspection Management view, Utilities tab, Collection Audit tab, and then the Reports tab. This tab lists the reports that have been generated, as well as the dates on which they were generated.Tip: Select the Utilities tab, Collection Audit tab, and then the Indicators tab to view summaries of the audit and indicator collection. Select from the table configurations on this tab to view detailed information about the most recent report.
3. On the Collection tab, you can select tabs to view indicators that are not being collected on standard tasks, indicators collected on multiple tasks, and indicators collected on one task. The Tasks tab lists all of the standard tasks that collect indicators for the asset.Tip: Right-click in any table and click Export to Excel to create a printable spreadsheet of the information.
4. Select the Details tab to view information about the report itself, for example, the triggering method and date when it was generated.
5. Select the Mismatches tab to view any criteria that differ between the indicator and the standard task.