You can set up the Analytics tab in the Site window,
Inspection Management view to display a variety of information, ranging from alarms, readings, and inspection reports to marine growth and platform cathodic protection. You can also specify the time period (in days, weeks, months, or years) for the data.
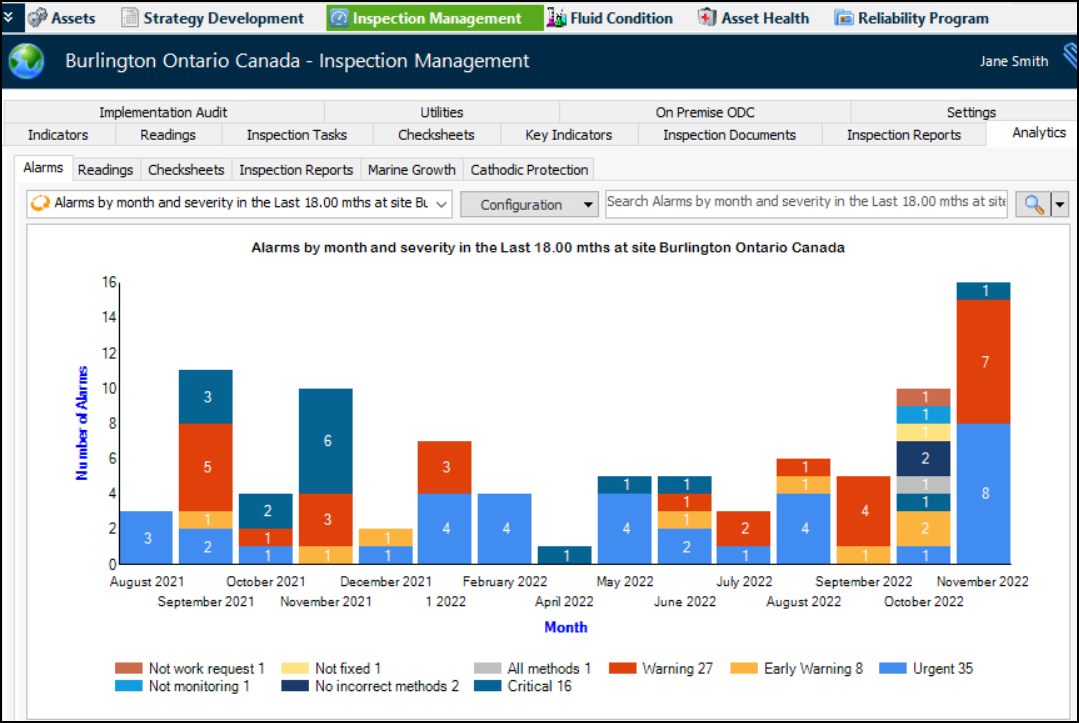
For example, here is the Analytics tab with the full complement of sub-tabs:
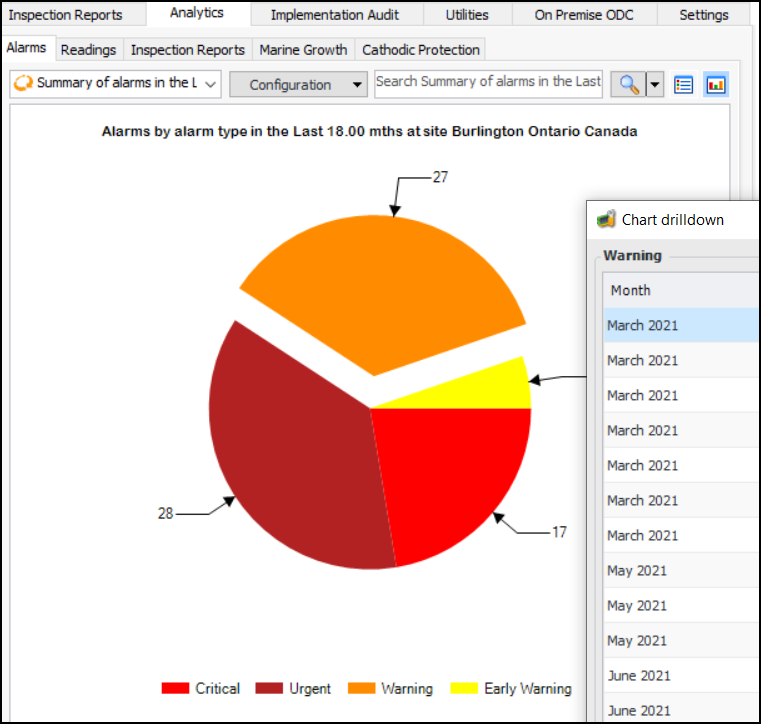
The Alarms tab offers configurations for:
The Readings tab provides a chart and tables that show indicator readings for a specified time period for the current site. Information is presented by time period and source or by source and time period. Sources can be:
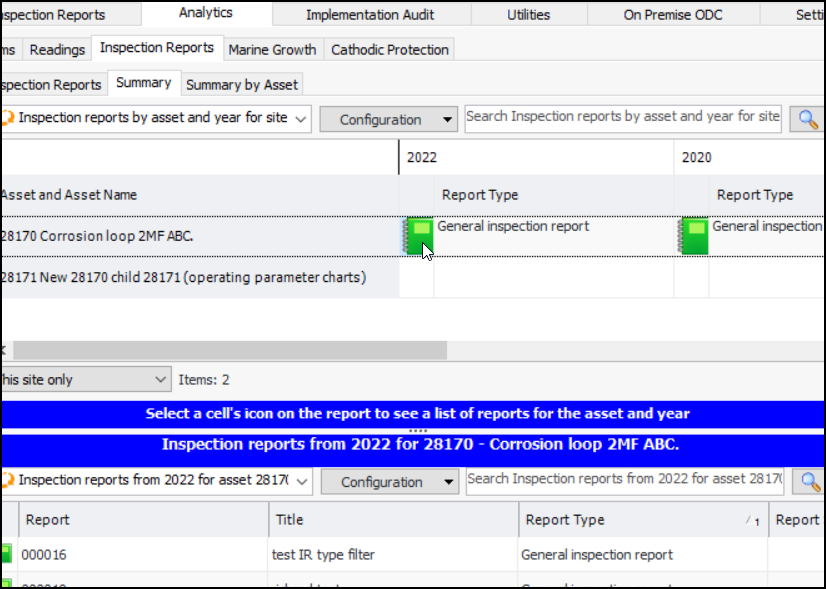
The Inspection Reports tab provides charts showing inspection reports by time period and status for the current site. Select the
Summary or
Summary by Asset tab to view specific assets’ reports. Click a report’s icon to list reports for the asset and year. For example:
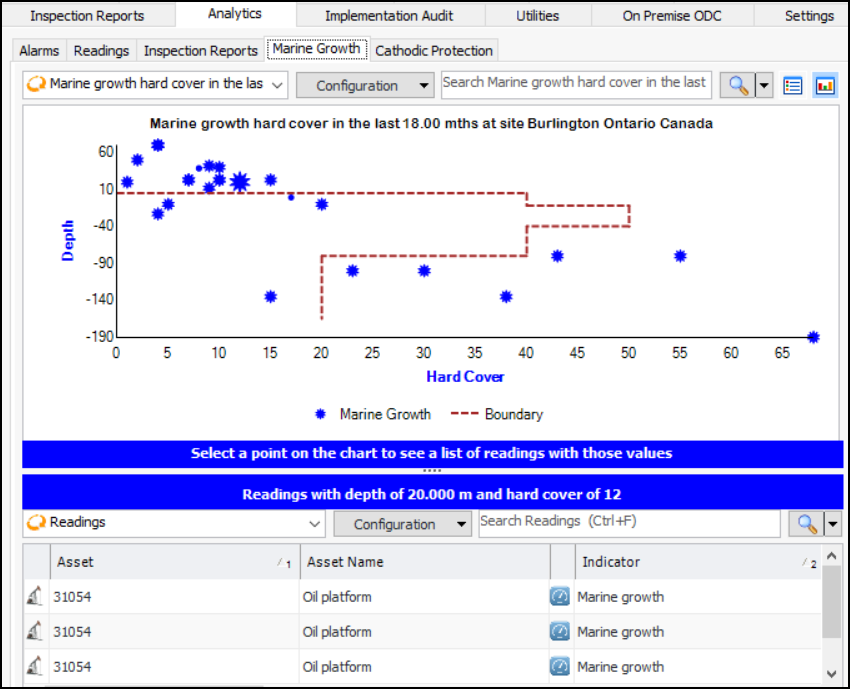
You can use the “Dashboard - Indicator Analytics Marine Growth” site panel in the Analytics tab and other dashboards to display a point style chart of measurement point readings with the marine growth subtype. Depth and Hard Cover are the chart co-ordinates.
You can also set up a boundary line to highlight readings outside of normal points. Define the chart line in the Charts tab and add it in the Inspection Analytics Settings dialog,
Marine Growth tab. For more information, see:
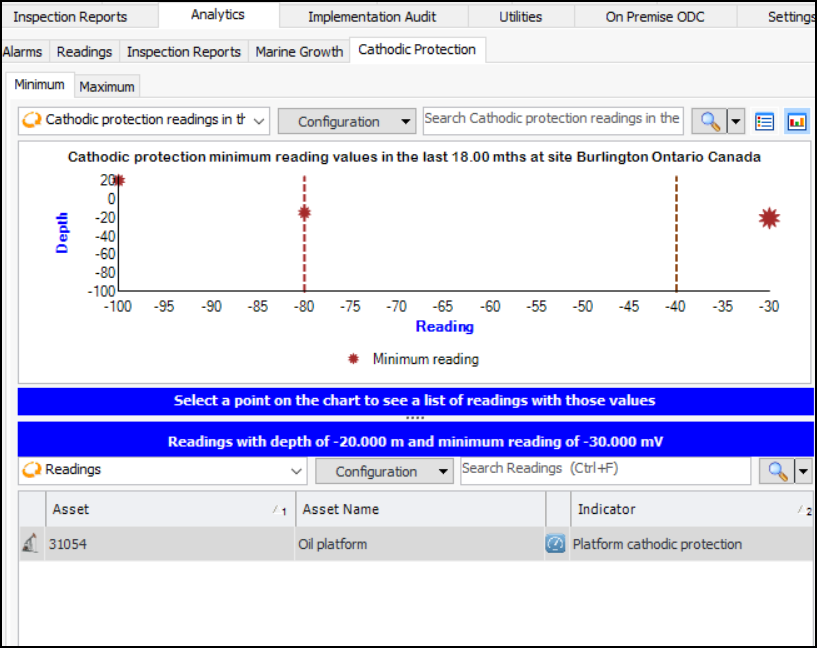
You can use the “Dashboard - Indicator Analytics Platform Cathodic Protection” site panel in the Analytics tab and other dashboards to display point style charts of measurement point readings with the platform cathodic protection subtype. One chart shows the maximum reading and the other the minimum reading. Depth and Reading are the chart co-ordinates.
You can also set up boundary lines to highlight readings outside of normal points. Define the chart lines in the Charts tab and add them in the Inspection Analytics Settings dialog,
Platform Cathodic Protection tab. For more information, see: