|
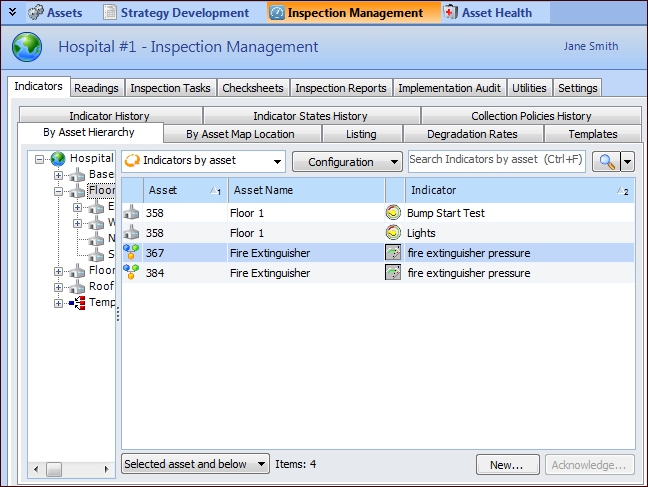
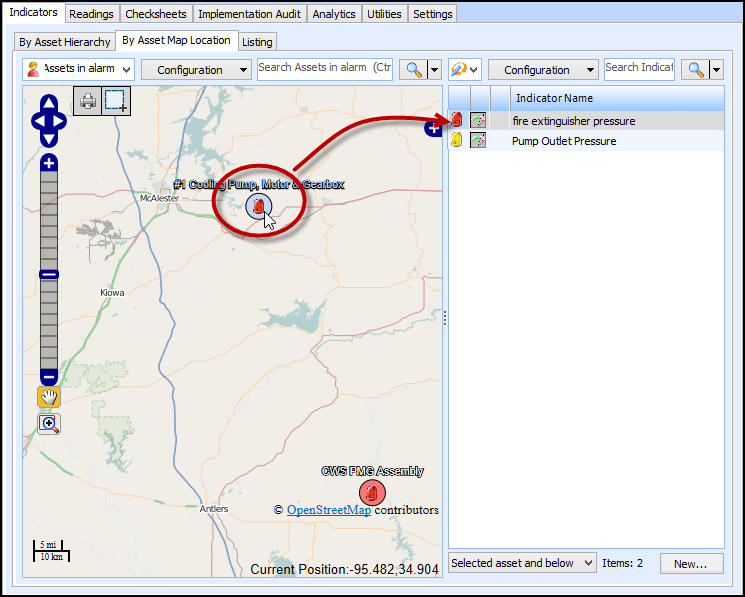
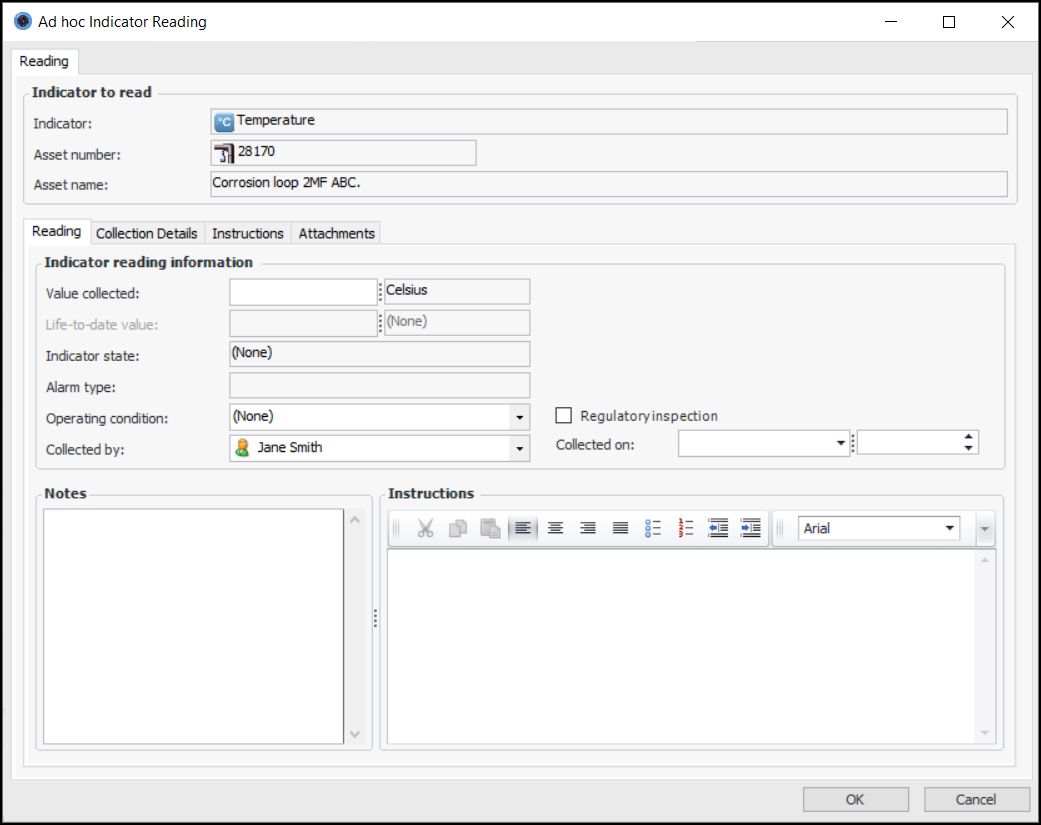
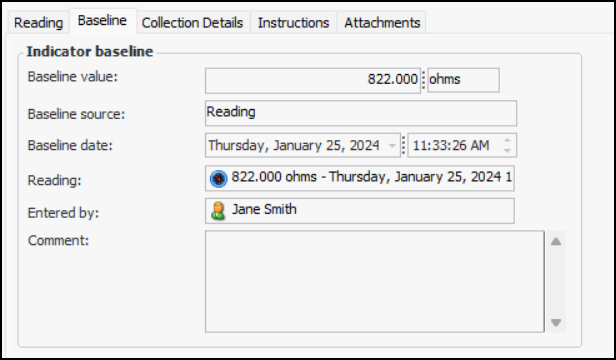
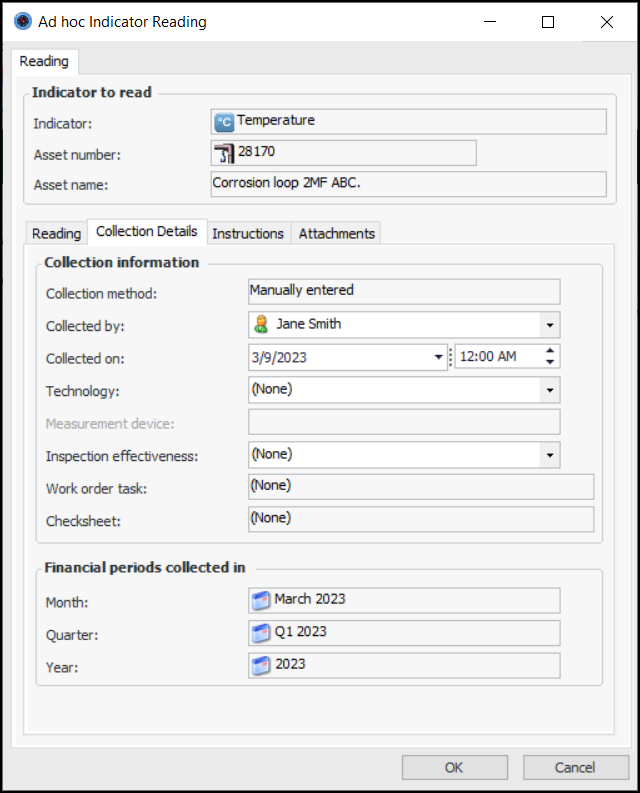
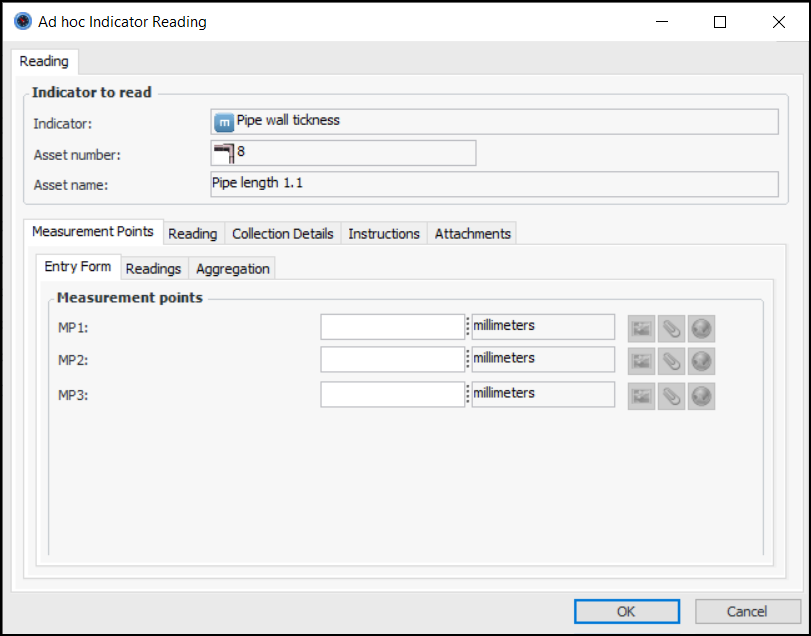
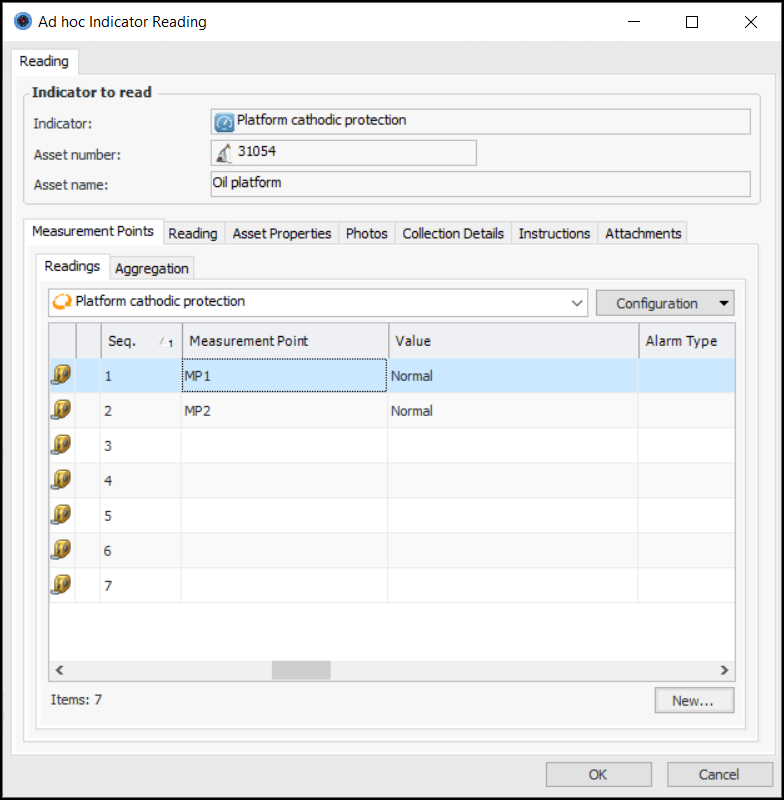
Entering Ad Hoc Indicator Readings
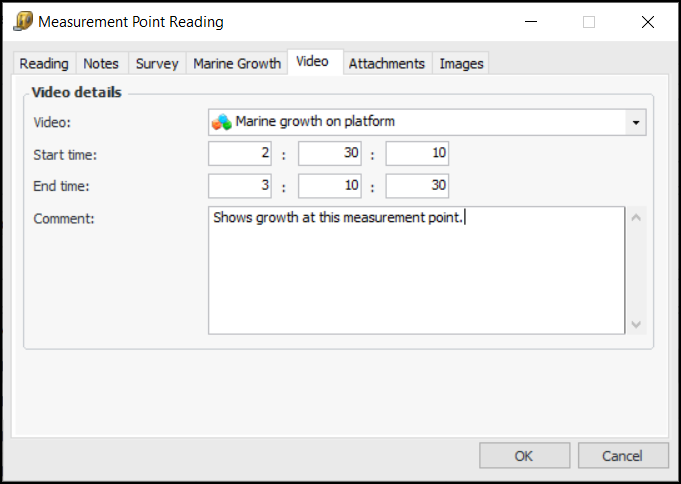
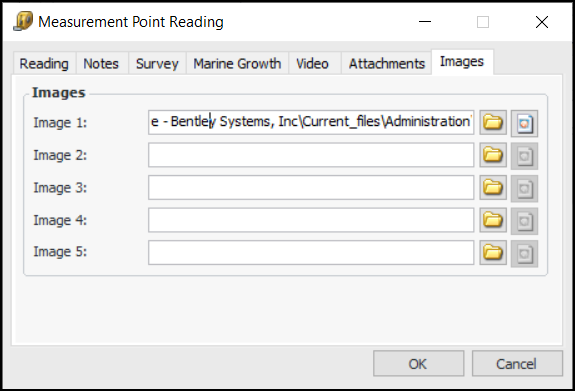
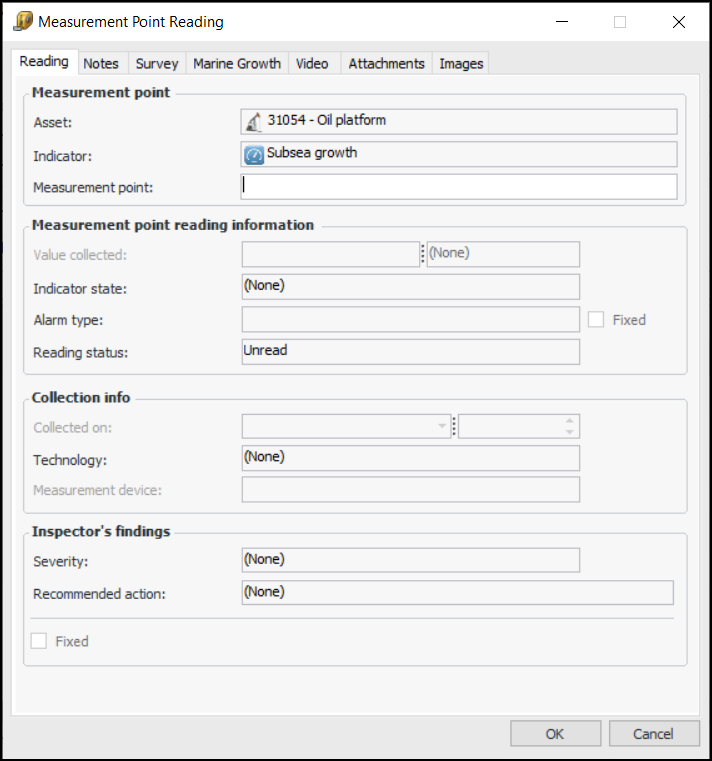
Measurement Point Readings
• Entry Form tab: This tab appears if there are fewer than nine fixed measurement points on the indicator. For example:You cannot create additional measurement points from the Entry Form tab. This method allows quick entry of basic data for the reading, especially if there are notes, attachments, or survey/subtype information. Each measurement point has an icon for entering additional information: Notes, Attachments
, and Survey and Subtype information
, where applicable.
• Readings tab: This tab displays all readings in a list format and allows measurement point readings to be entered using in-place editing. For example:Tip: You can also double-click a measurement point on the Readings tab to open the Measurement Point Reading dialog.To Enter a Single Ad Hoc Indicator Reading
1. Tip: You can also select an asset on the map from the By Asset Map Location tab. By default, indicators for the selected asset and below are listed in the table. For example:
3. Right-click the indicator and click Enter Reading. The Ad Hoc Indicator Reading dialog appears.
4. Refer to the Instructions box for any information needed to collect the reading.
5. If the Baseline tab is available, select it to see the indicator baseline information. For example:
6. On the Reading tab, enter the value for the reading.
9. Select the Collection Details tab, for example:
12. Select the Photos tab and click Browse to add inspection photographs to the reading. For more information, see Adding Inspection Photographs to Objects.
13. Select the Attachments tab to add separate documents to the reading.
14. Click OK to save the reading and close the dialog.
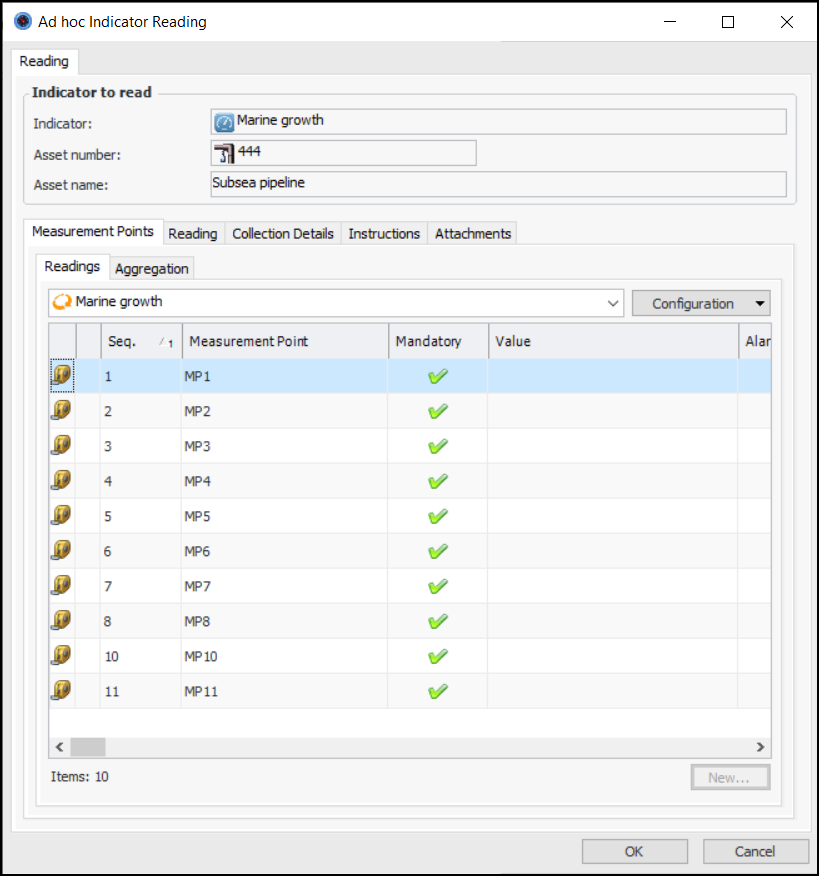
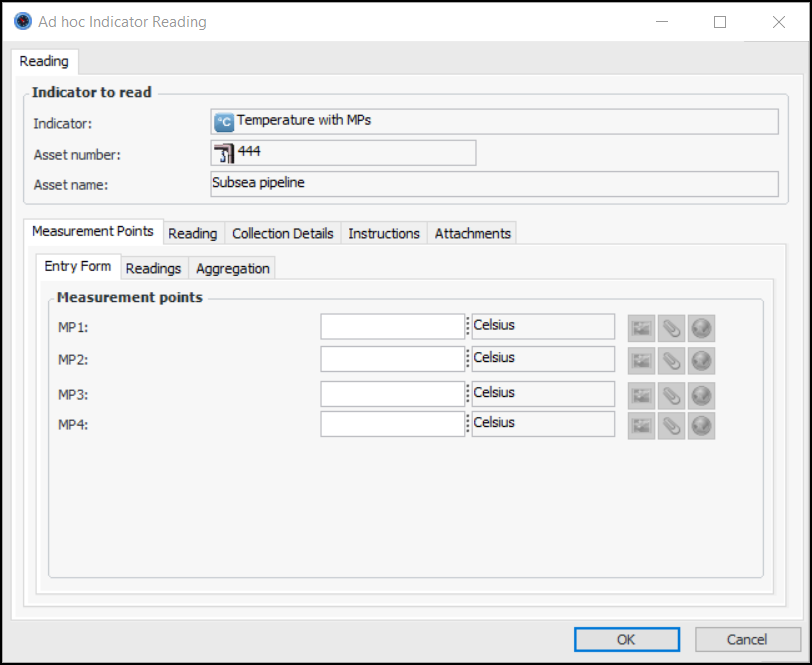
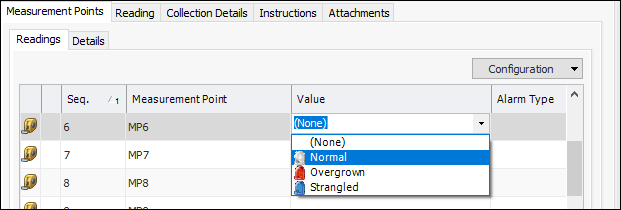
To Enter Ad Hoc Readings for Measurement Points
1.
3. Right-click the indicator and click Enter Reading. The Ad Hoc Indicator Reading dialog appears. Here is the dialog for an indicator with fixed measurement points; that is, the points are named:Any required points have check marks in the Mandatory column when they are shown in a table.The Aggregation tab displays information about the indicator and the readings, including the aggregated value of the readings, the aggregated state, the method of aggregation (sum, average, median, maximum or minimum), and the measurement point used to determine the overall reading if a single point is used.
4. Refer to the Instructions tab for any directions for taking the measurements.
• On the Readings tab, select a row and press F2. The row is opened for editing. For example:
• On the Readings tab, double-click a row to open the Measurement Point Reading window. Fill in the information required and click OK. The information is added to the Readings tab.Tip: If the checksheet type supports videos, in the Measurement Point Reading window you can select the Video tab to add a link to a video file. In the Video list, select one of the files assigned to the checksheet. Specify the start and end times (hours:minutes:seconds) for the footage that pertains to the reading. For example:Tip: In the Measurement Point Reading window, select the Images tab to add a link to an image file by clicking. You can view the image by clicking
. The path to each file is shown. For example:
7. From the Readings tab, you can also add variable measurement points. Click New. The Measurement Point Reading dialog appears. For example:Click OK. The Measurement Point Reading dialog closes and the measurement point is added to the table.
9.
10. On the Collection Details tab, you can modify the date and time the reading was collected, if necessary. If the indicator uses a technology associated with measurement device assets, you can select the measurement device used to take the reading.
11. Select the Attachments tab to add separate documents to the reading.
12. When you have finished entering readings, click OK to save the reading and close the dialog.