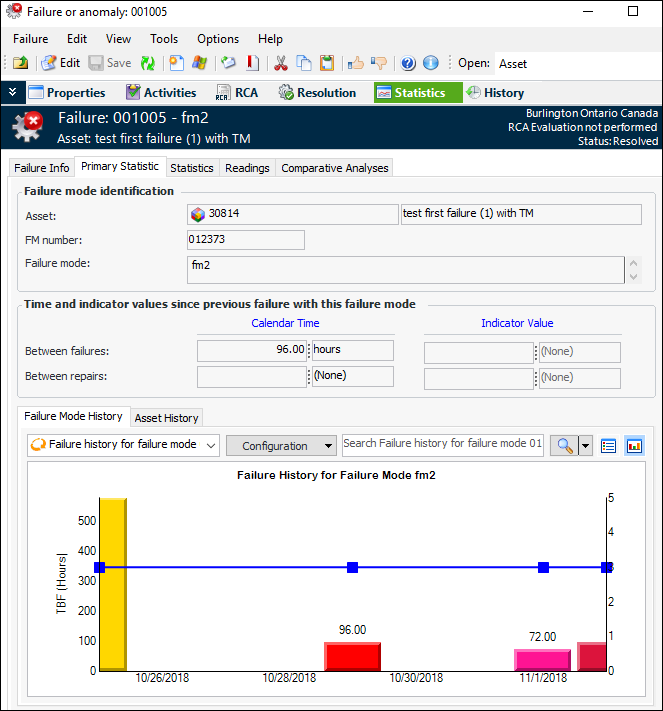
Viewing Failure Statistics

Based on the current and prior failures for an asset and failure mode, APM calculates three types of statistics: time between failures (TBF), time between repairs (TBR), and restoration times (RT).
Time Between Failures (TBF): The time between the start of the previous failure and the start of the current failure.
For the initial failure, the start date is determined to be the first available of the following options:
The TBF is then calculated as the duration between the start date and the failure’s resolved-at date.
APM calculates the mean time between failure (MTBF) as the average time between occurrences of a failure, assuming that the asset has a constant rate of failure.
Time Between Repairs (TBR): The time between the resolution of the previous record and the date on which the current failure occurred. TBR can also be calculated as TBF minus RT.
Restoration Time (RT): The time between the date and time when the current failure occurred and the date and time when it was returned to service.
For example:
The values are calculated for the asset that failed and each of its ancestor assets. This provides statistical information on the reliability of the lowest level component, the equipment, the system, and the plant itself.
Restoration time is broken down into three statistics:
Restoration Time (RT): The total time to restore the asset to its normal operating condition. This is the total elapsed time from when the failure occurred until the asset is returned to service.
Maintenance Time (MT): The portion of the restoration time for which maintenance is responsible. This is the time from when the failure is reported until the failure is resolved, minus any operational delays.
Time to Repair (TTR): The actual time associated with the asset repair. Repair time is equal to restoration time minus all delays.
For the previous failure, APM looks for the failure with the same asset and failure mode or problem that occurred immediately prior to the current failure.
Statistics can be calculated in terms of both calendar time and the unit of measure of the asset’s primary cumulative indicator. The calendar time is a simple calculation of the days and time between two failures. The indicator-based value sums the readings accumulated between two failures. The asset’s primary cumulative indicator is used in the calculation. The statistics are expressed in the indicator’s unit of measure.
APM uses the indicator reading closest to the failure’s occurred-on and resolved-on dates in its calculations. For example, if a reading was entered five days prior to the failure and the next reading is entered eight hours after the failure is resolved, the reading entered after the failure is used. Conversely, if a reading is entered 20 minutes before a failure and the next reading is entered 45 minutes after the failure, the reading entered before the failure is used.
If a primary cumulative indicator has not been defined for an asset, only the calendar-based failure statistics are calculated.
Statistics are usually calculated periodically by a scheduled action. However, you can also manually launch the calculate action. For more information, see Manually Recalculating Failure Statistics and PF Intervals.
This topic describes two ways to view an asset’s failure statistics: using key performance indicators to track an asset’s failures over time and viewing statistics for a particular failure.

Key Performance Indicators

You can create key performance indicators (KPIs) for failure tracking, including:
Failures: Mean time between failure in the last 12 months – The average time between occurrences of a failure within the last 12 months
Failures: Mean time between failure last month– The average time between occurrences of a failure within the last month
Failures: Mean time between repairs in the last 12 months – The average time between the resolution of one failure and the next occurrence of the failure within the last 12 months
Failures: Mean time between repair in the last month – The average time between the resolution of one failure and the next occurrence of the failure within the last month
For information about setting up and using KPIs, see Creating Performance Indicators From a Template.

To View a Failure’s Statistics

1.
2.
Select the Primary Statistic tab. This tab identifies the statistics shown, which can be for the asset itself, the failure mode, or the problem identified in the failure. In this example, the failure cites a failure mode:
Separate history tabs provide information about the types. Information in the history tabs can be shown as charts or tables.
Tip: Select the Statistics tab to view all statistics in a table. You can double-click an individual to open its Failure Statistic Details dialog.