|
|


Viewing 4D Indicators and Readings
You can review indicator readings in 4D charts, where the Analytical Viewer provides a view into the Influx data. Readings tabs list the readings that have been pushed to APM from 4D Analytics processes, as well as any indicator readings entered directly in APM.Table Configurations for 4D Indicators
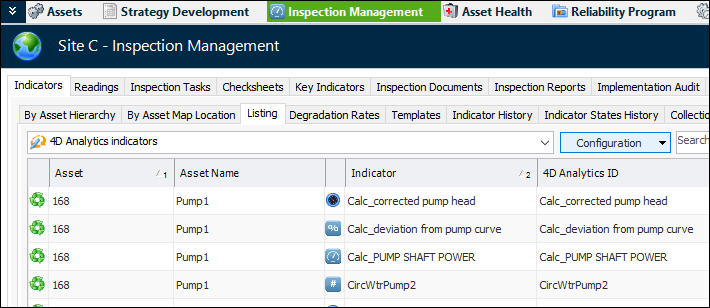
To View 4D Indicators for a Site
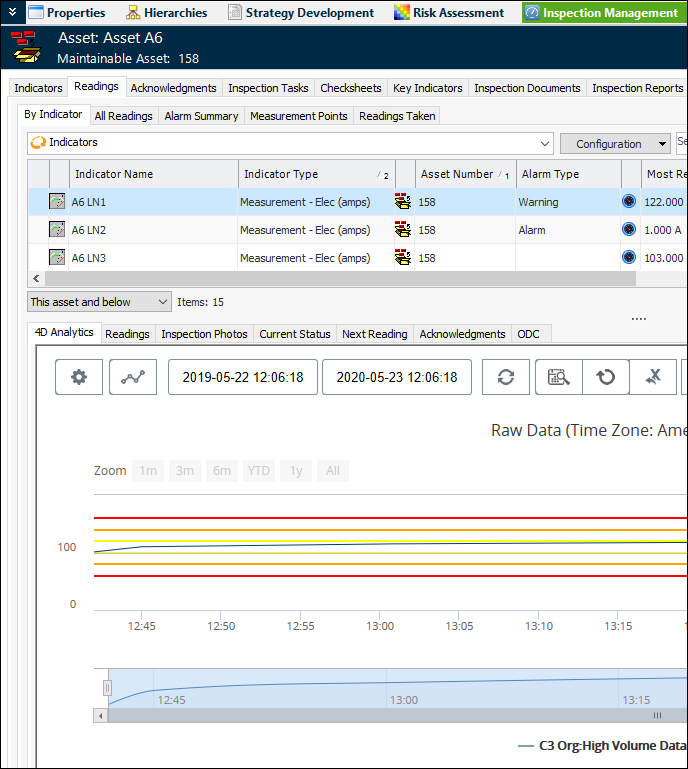
To View 4D Indicators for an Asset
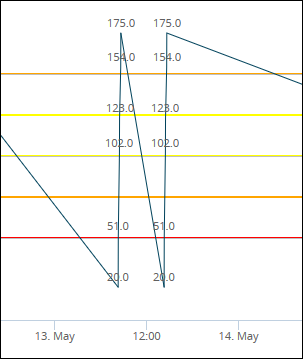
Viewing 4D Charts
To View 4D Charts for the Site or Asset
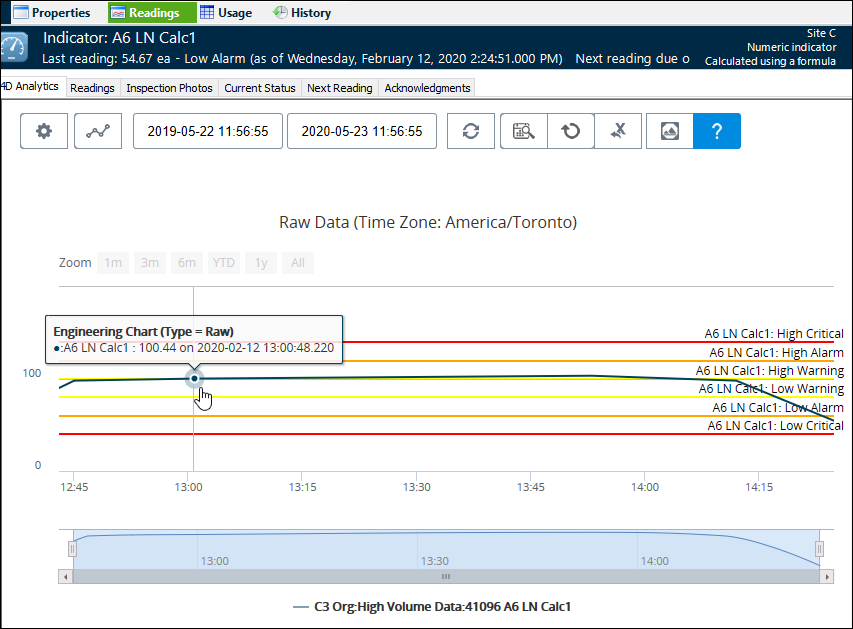
To View 4D Charts for an Indicator
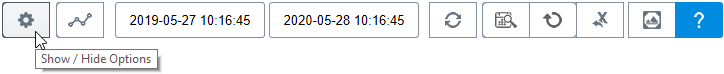
Analytical Viewer Tools
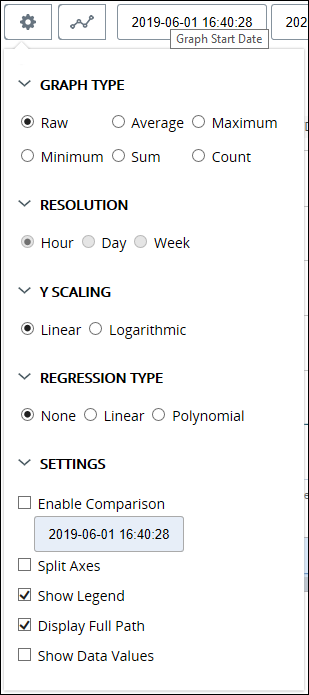
Show/Hide Options
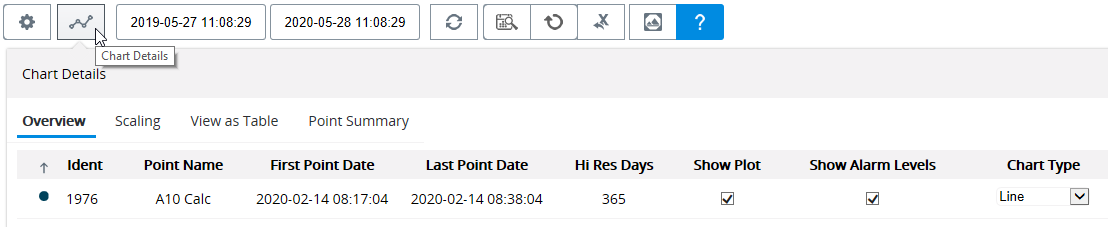
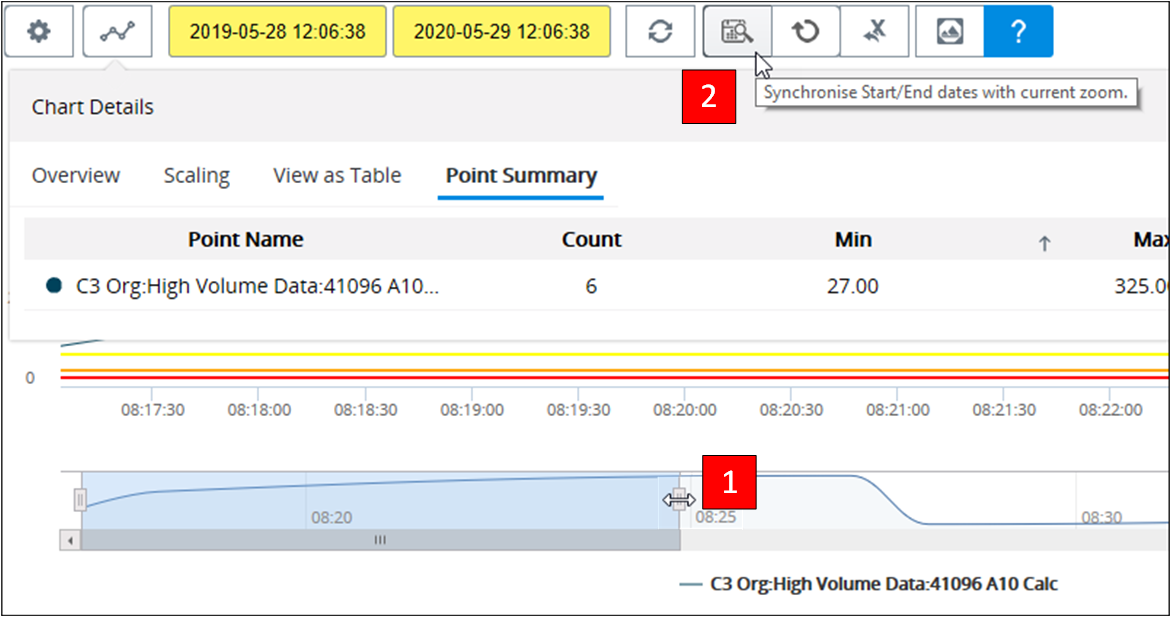
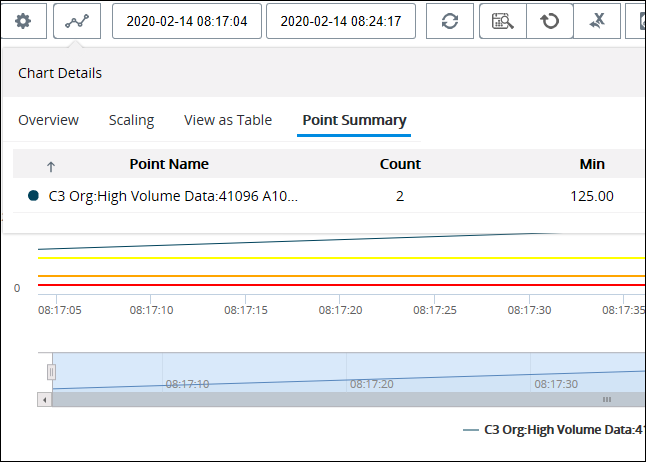
Chart Details
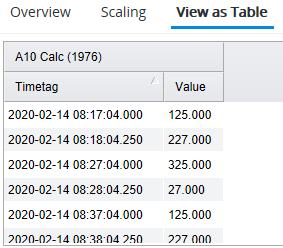
Select View as Table to see a list of the reading values and their collected-on dates. Click a column heading to sort on that column’s values:Select Point Summary to see a count of the values in the chart, as well as the minimum, maximum, and average values.Graph Dates
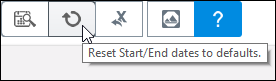
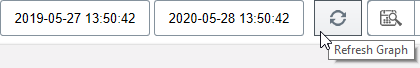
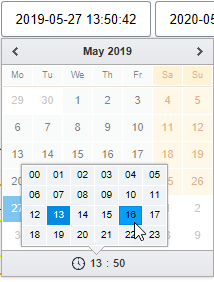
Timeline
Export to Excel
Download