|
|


Creating a Degradation Indicator
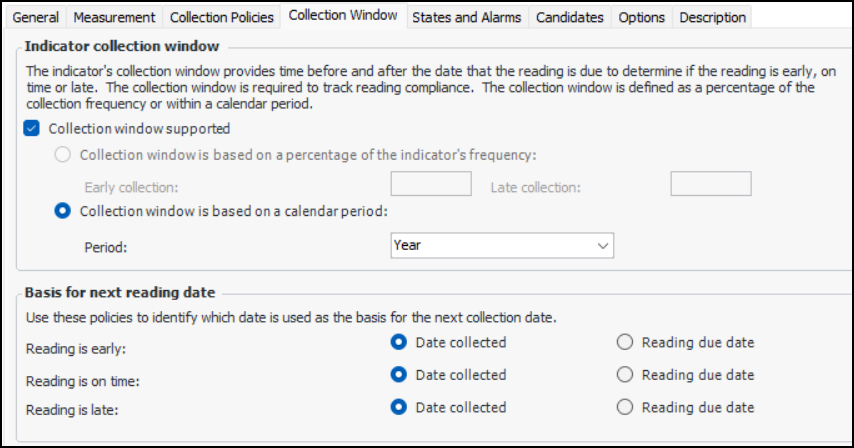
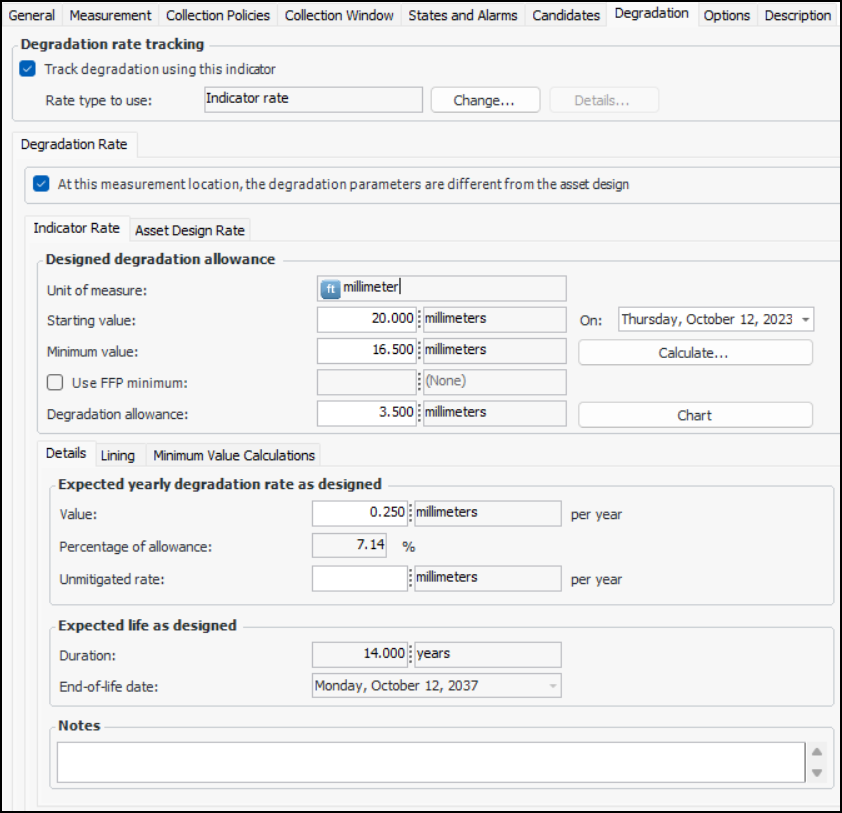
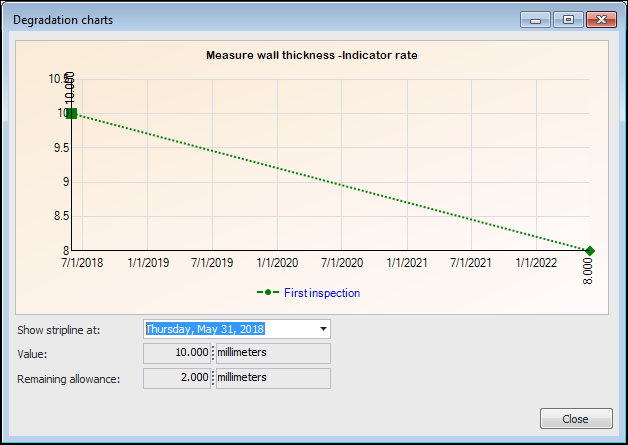
Degradation indicators can be created from the Asset window’s Degradation Info tab, as well as from strategy development analyses (MTA2, RCM2, RBI, CPR). They can also be created from scratch and designated as degradation indicators.On an asset, you can select a representative degradation indicator to make it easier to show the current degradation values. For more information, see Adding Degradation Information to an Asset.Using the indicator’s collection policies, you can specify how its reading due dates are calculated. You can also set up the indicator’s collection window to define early and late collection periods. You can track collection compliance using table configurations, sidebar dashboards, and KPIs. For information about viewing an indicator’s collection status, see Viewing Indicator Collection Compliance.Note: Once degradation information is saved with an indicator, you can no longer edit it by checking out the indicator. Instead, the Change button is available on the Degradation tab. After you change values, the asset’s indicators are updated and their readings’ degradation rates are recalculated. For more information, see Changing an Indicator’s Degradation Rate.Minimum Value Calculations
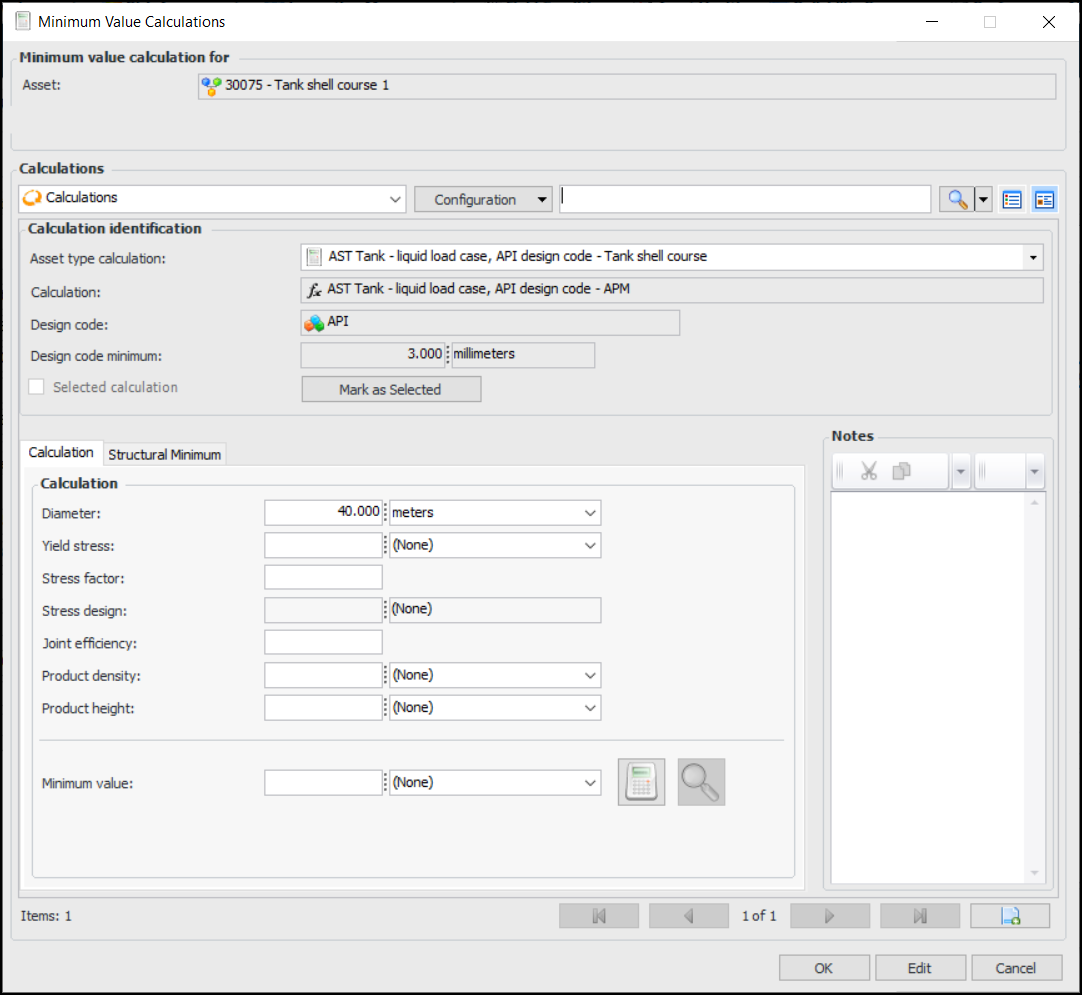
If the Minimum Value Calculator is supported by the asset type, you can have APM calculate the asset’s minimum degradation value using the formula appropriate to the asset type and design code (for example, API or BSI). Using the Minimum Value Calculations dialog, you can enter the asset’s dimensions and specifications and then click Calculate to arrive at a minimum value. You can try other formulas and inputs and then select the appropriate result to assign to the asset’s degradation information.Tip: The formulas that are used to create calculations are provided by industry standards organizations, such as API (American Petroleum Industry), BS (British Standards), and ASME (American Society of Mechanical Engineers). For example, APM provides two versions of the liquid load case calculation for atmospheric storage tanks (API and BS design codes). For information about setting up calculations for your organization, see Creating a Degradation Minimum Value Calculation.Structural Minimum Thickness for Pipe
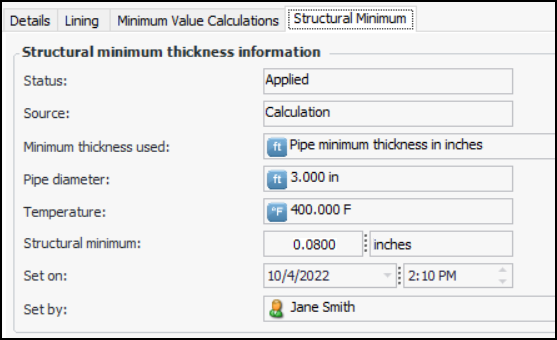
The Structural Minimum tab appears in the Asset window, Properties view, Degradation Info tab. After calculating the minimum value, select the Structural Minimum tab to see whether the structural minimum value was applied. For example:Lining Degradation
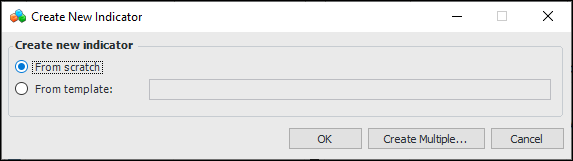
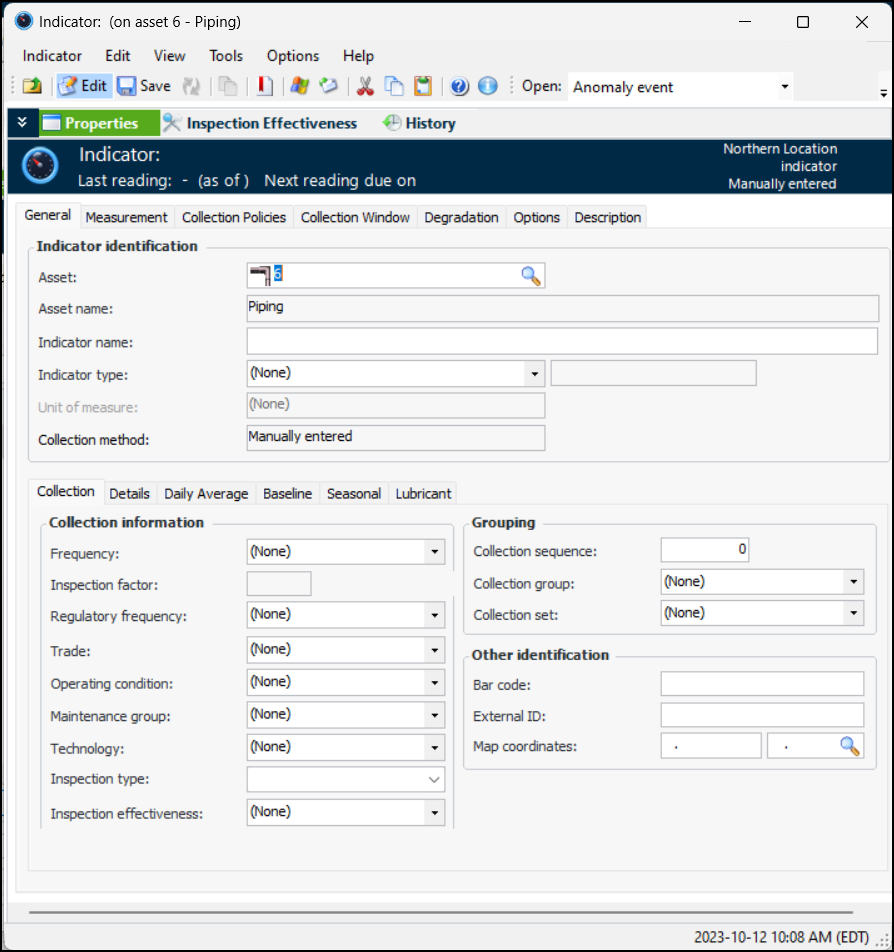
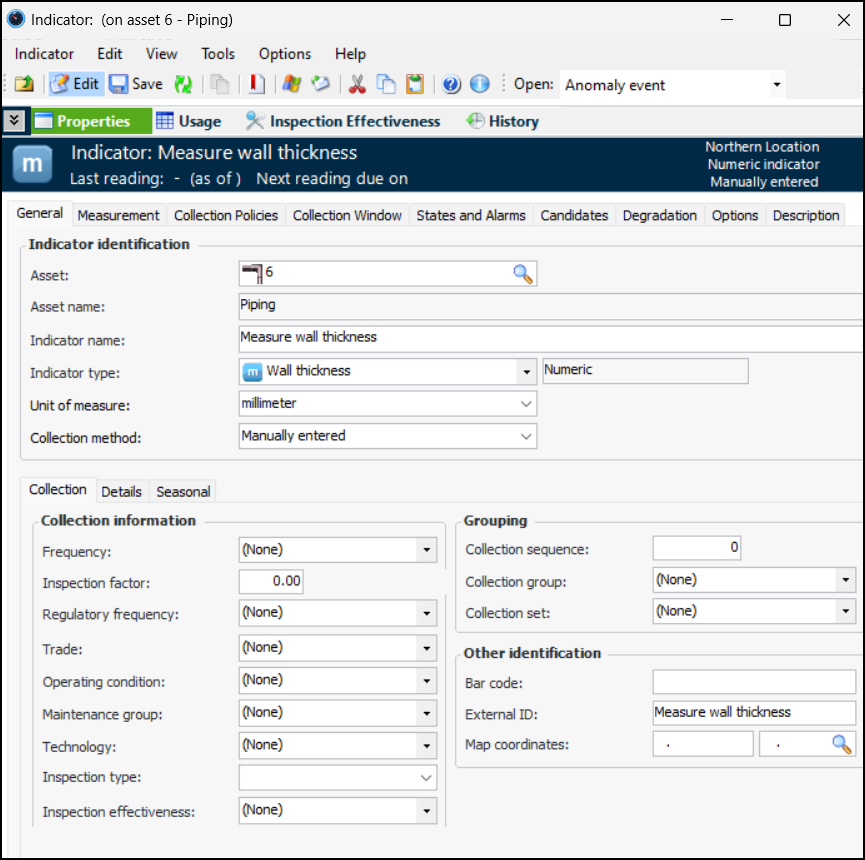
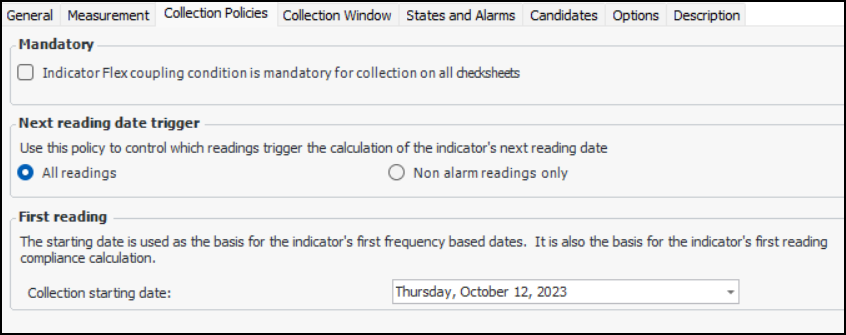
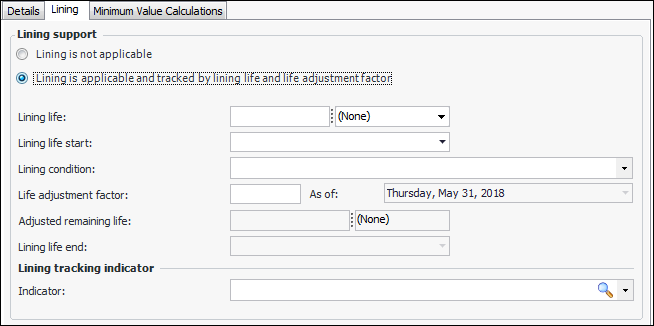
The life adjustment factor can be set manually, or it can be determined using strategy development analysis. See To Evaluate Confidence Factors in “Performing Risk Analysis for RBI Failure Modes”.To Create the Indicator
To Add Degradation Information
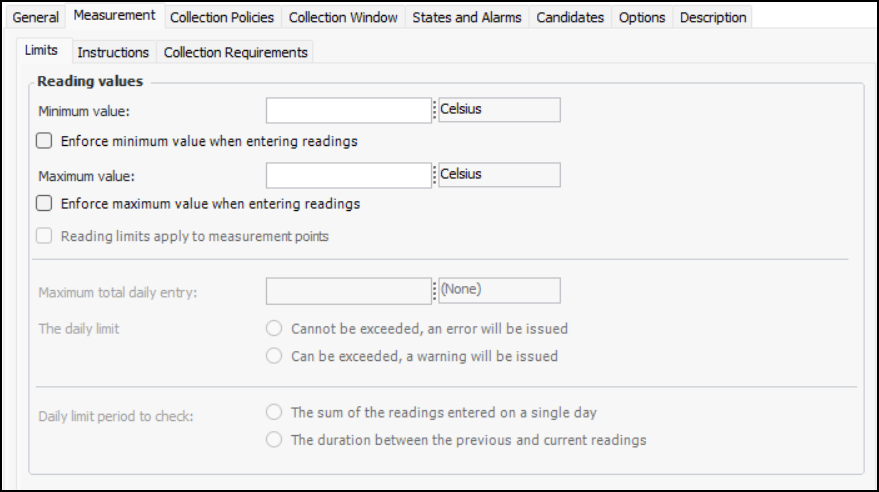
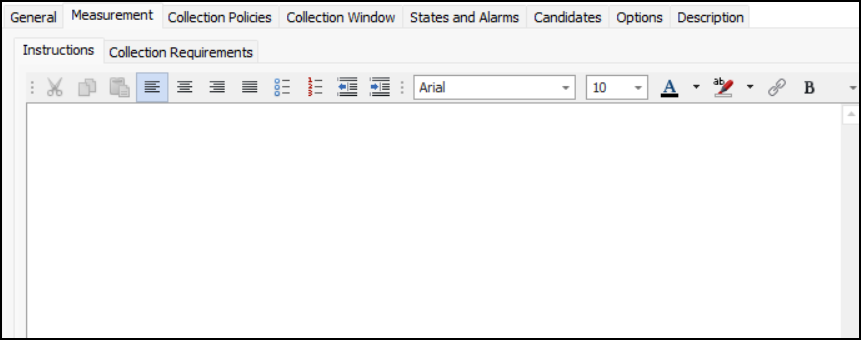
To Calculate the Minimum Degradation Value
to add a calculation. If available, select a calculation from the Asset type calculation list. The calculation values are added to the dialog. For example:
) to view the results in the Minimum value box.
Tip: To see the results in more detail, click the View Results icon. The Calculation Results dialog shows you the value calculated and data availability. Select the Results by Variable tab to view the calculation expression and the result values for each variable.
To Add Lining Degradation Information
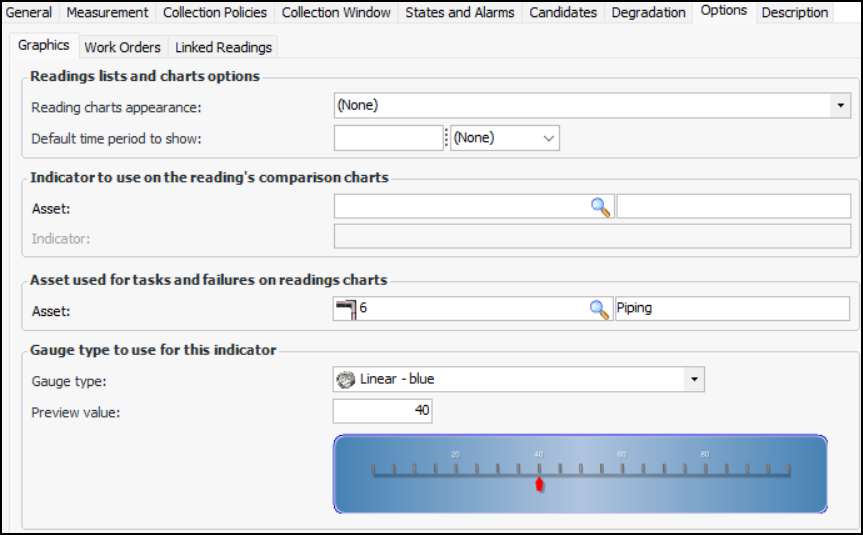
To Set Options for the Indicator
To Select a Representative Indicator
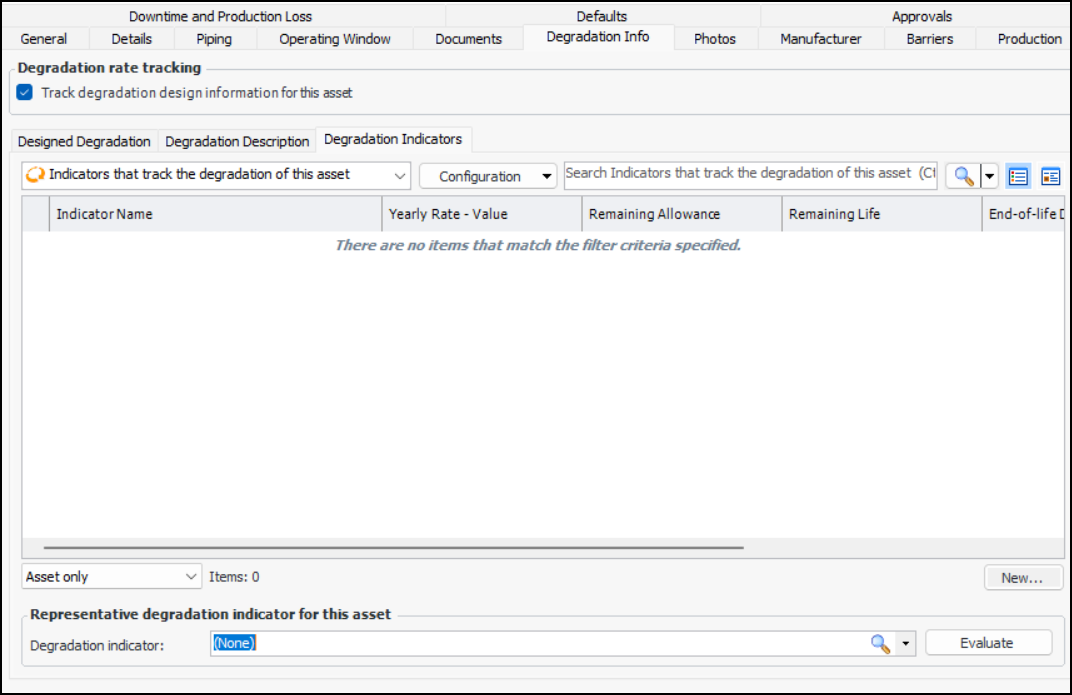
In the Asset window, Degradation Indicators tab, select an indicator in the Representative degradation indicator for this asset area. The representative indicator is used to show current degradation values for the asset. You can browse to select a degradation indicator from the asset’s parent or child assets.