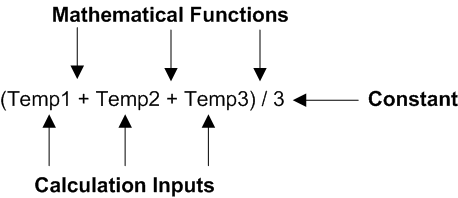
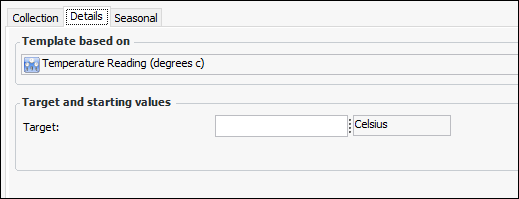
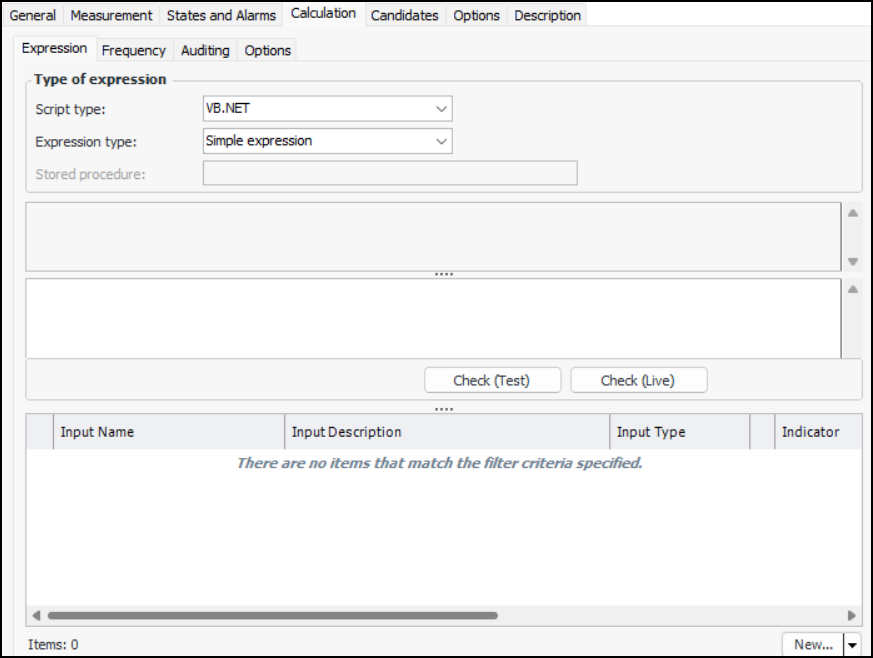
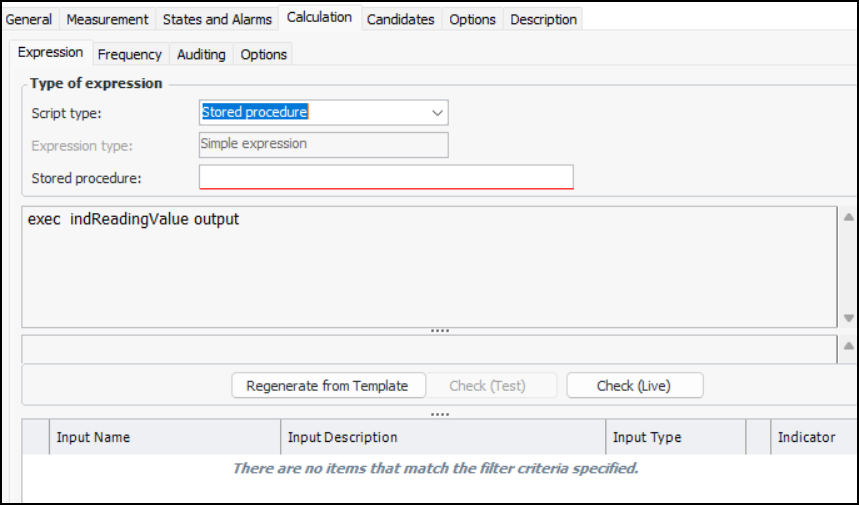
Creating a Calculated Numeric Indicator

A calculated indicator is an indicator that has its readings calculated using a formula, rather than entered manually by a person or electronically by an on-line system.
You can set up a calculated indicator to record information about an asset condition that is not directly available from a measuring device on the asset. For example, you could set up a calculated indicator to measure the efficiency of a pump. Because this is difficult to measure directly, you can create a formula that uses other indicators on the pump that you can measure. You can set up numeric, cumulative, and descriptive indicators as calculated indicators. You can use data from other asset indicators or from APM objects as part of the calculation.
This topic explains how to create calculated numeric indicators.

VB. NET and C# Scripts
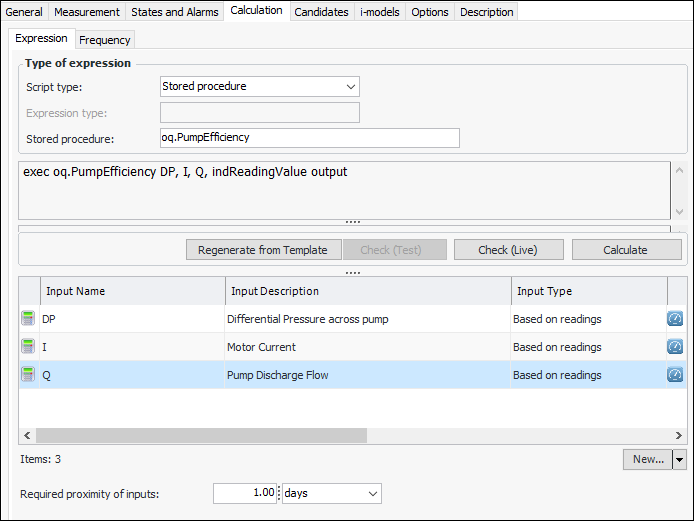
You can create a formula for a calculation based on three types of information:
Calculation inputs: data from another numeric, cumulative, descriptive, or rule-based asset indicator; data from the current calculated indicator; or data derived from an APM object (for example, a count of work orders or the dates when indicator readings were entered)
Mathematical functions: such as add, subtract, multiply, or divide
Constants: a fixed value used in the calculation
For example, a calculation for determining the average of three indicator values might be:

Stored Procedures

You can enter the formula for a calculated indicator in APM as a VB.NET or C# script. However, if you need a complicated calculation requiring extensive or complex processing, you can use a stored procedure. At run-time, the indicator is recalculated in the normal way, either manually based on an input or based on a recurrence pattern.
When calculated, the value of the inputs are fed to the stored procedure. The stored procedure must return either a number or a string, and this value is used to create the reading for the indicator. If a calculation fails, a reading is still created, but it is flagged as “Invalid” and the appropriate reason for the invalid reading is noted.
When defining the indicator, provide the name of the stored procedure and calculation inputs with names that correspond to the parameters used in the procedure. A calculation input and its parameters must use the same data type, and the procedure must include a return parameter that is either a string or number. You can create calculation inputs for stored procedures as you would for a VB.NET or C# script, except that the inputs cannot use the array aggregation type.
Note: When using Date and DateTime data types, be aware that the Date type uses the enterprise time zone, and the DateTime type uses Coordinated Universal Time (UTC).

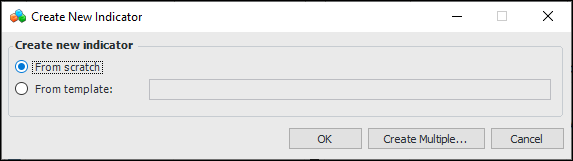
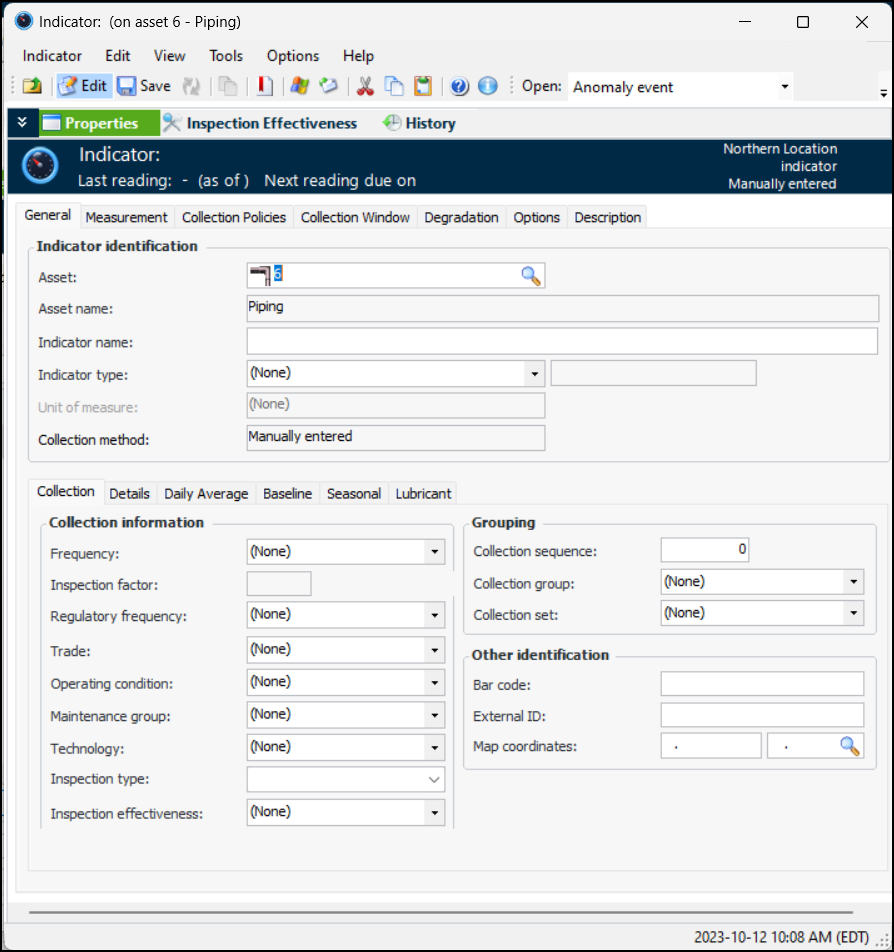
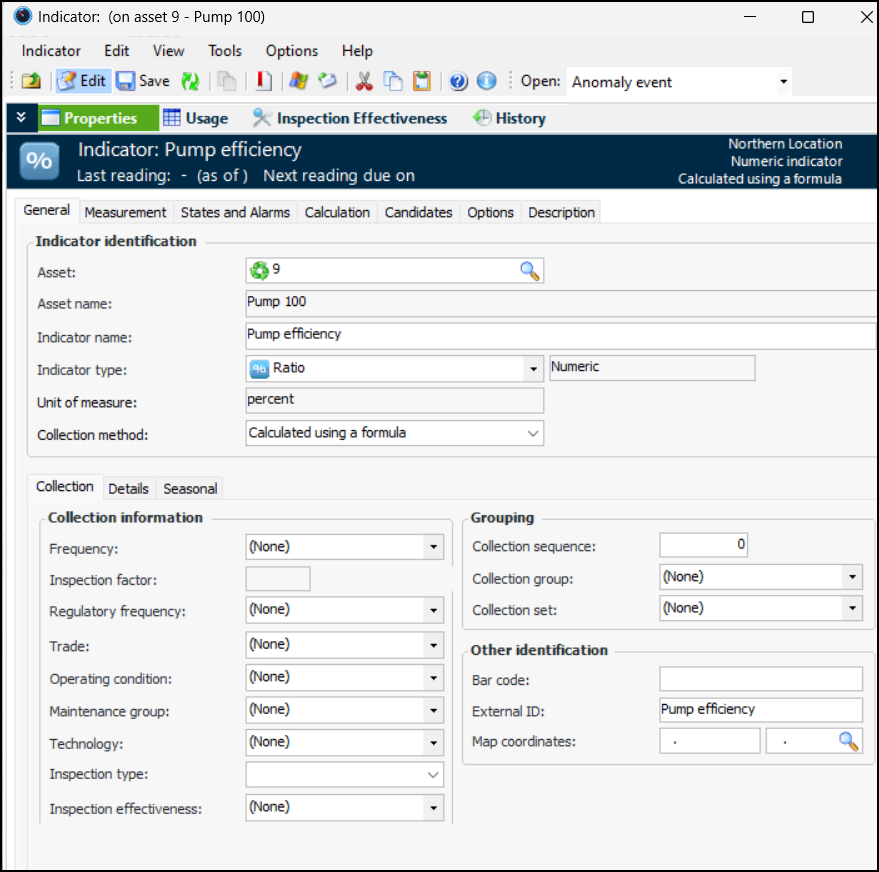
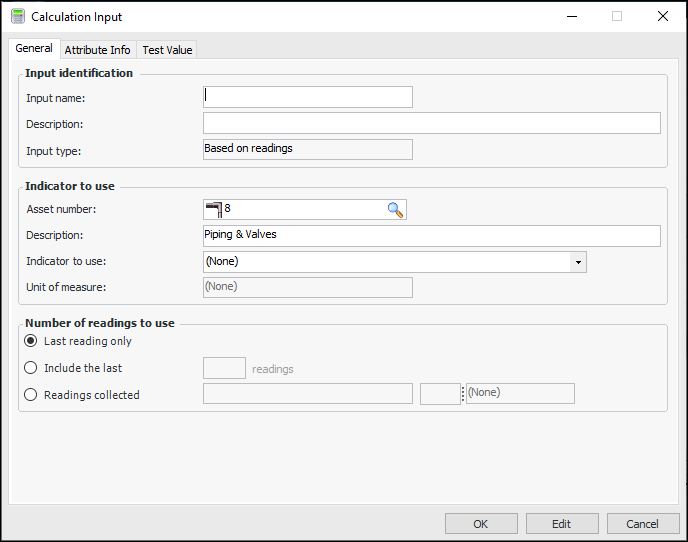
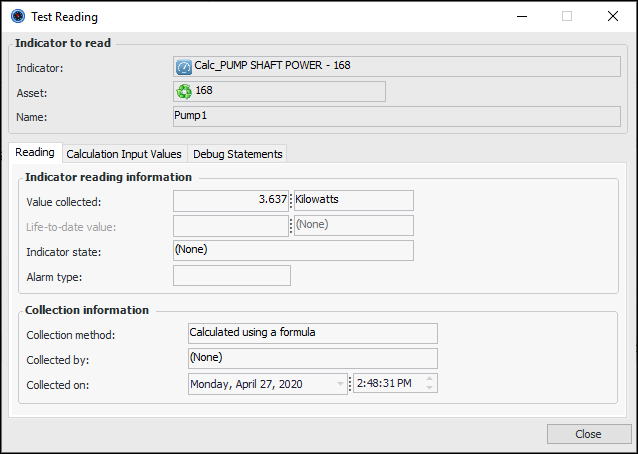
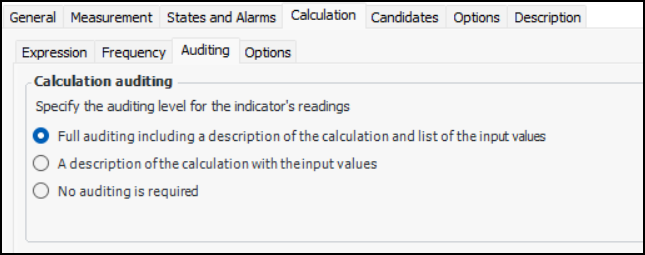
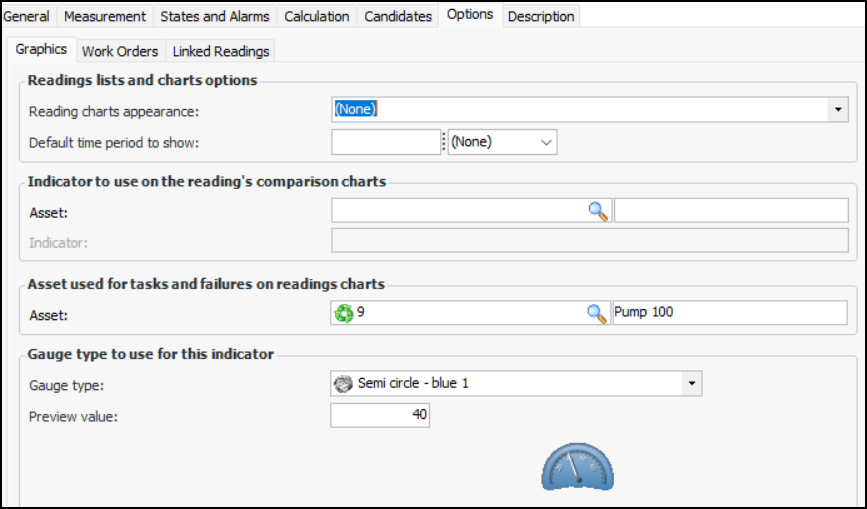
To Create a Calculated Numeric Indicator

1.
Open the asset that needs the indicator. Select the Inspection Management view, Indicators tab.
2.
Click New. The Create New Indicator dialog appears.
3.
Select From scratch and click OK.
4.
5.
On the Properties view, General tab:
Select a numeric indicator type from the Indicator type list. The tabs on the window change to reflect the numeric value type.
6.
7.
In the Collection method list, select “Calculated using a formula.” The Calculation tab is added to the window. For example:
8.
On the Collection tab, you can enter values that determine how often readings are expected and the next collection date. You can also enter information to make it easier to select this indicator when adding indicators to a work order task or standard task, when copying indicators to another asset, when setting up dynamic inspection routes, or when implementing reliability programs.
If you are creating the indicator from a strategy development analysis (MTA2, RCM2, RBI, CPR), the searching values (frequency, regulatory frequency, trade, operating condition, maintenance group, and technology) are automatically copied from the associated action plan, if the analysis’ indicator settings allow it. In this case, you need only verify the values.
Note: Any changes that you make to the searching values are not copied to the indicator’s associated action plan.
Review and select values, as appropriate:
Tip: If the technology is linked to an asset type that is used to collect indicator readings, you can identify the measurement device on indicator readings and checksheets.
9.
The target value is displayed on charts and dashboards that show readings for the indicator. In this example, the target line appears as a red dotted line on charts:
10.
To specify the months during which readings should be taken, select the Seasonal tab. Click This indicator is collected seasonally and select the starting and ending dates. For example:
Reading due dates will reflect the seasonal settings.
11.
Select the Measurement tab and the Limits tab to set limits on the values that users can enter in readings. For example, if you enter a minimum value of 0.000 Celsius, a user who enters a negative number when recording a reading will receive the message, “The value entered cannot be less than 0.000 Celsius.” To set limits on readings:
Select Minimum value is enforced when entering readings and Maximum value is enforced when entering readings, as appropriate.
12.
13.
Select the Calculation tab.
14.
On the Expression tab, select the type of expression. A calculated indicator can be based on:
VB.NET – Inputs and functions defined on the Calculation tab can be used to create a formula that is calculated at run time. This is the default option
C# – Inputs and functions defined on the Calculation tab can be used to create a formula that is calculated at run time
Stored procedure – The expression is provided in a stored procedure that receives its inputs at runtime and returns a value
15.
With the Complete class option, a starter script template is provided automatically, which you can edit as needed. You can also click Regenerate from Template to reset the formula to the starter script.
The template scripts include DebugData statements that you can augment to output trace messages when the Check (Test) or Check (Live) method is invoked to test the calculation.
Tip: You can view the template scripts by opening the Enterprise window, clicking the Administration menu and then Calculation options. For more information, see Defining Calculation Options.
16.
If you are entering a function, see Using Logical Operators and Functions.
If you are using a formula, you can use three elements:
Example:
To enter a calculation that takes the average of two indicators, you would type:
(Indicator1 + Indicator2) / 2
The variables “Indicator1” and “Indicator2” are placeholders for data from asset indicators. When the calculation is evaluated, APM gets the current values of the indicators.
17.
Provide the name of the stored procedure.
18.
From the New list, select either Indicator Input or Filter Input. The Calculation Input dialog appears. Here is an example for an indicator input:
For detailed instructions on creating each type of input, see the following topics:
19.
Click OK when you have finished creating the input. The Calculation Input dialog closes and the input is added to the table of inputs.
20.
For VB.NET and C# expressions, you can check the syntax (the order of the elements) of your calculation by clicking Check (Test) on the Expression tab. APM looks for errors in how you have typed the calculation. In addition, the system uses the test values on the inputs to complete a test calculation. You can use the result of this calculation to check that the expression is giving the desired results.
21.
To use the test values on the inputs to complete a test calculation, click Calculate. You can use the result of this calculation to check that the expression is giving the desired results.
22.
When you have defined the calculation expression and inputs, you can click Check (Live). The test function uses the values from the inputs (for example, indicator readings) and displays the result in the Test Reading window. For example:
Select the Calculation Input Values tab to see the individual input values. If the calculation formula includes DebugData statements, the Debug Statements tab shows the result.
Click Close when you are finished.
23.
Ensure that the parameters in the stored procedure match the input names and that the procedure includes a return value parameter.
24.
If necessary, you can change the Required Proximity of the calculation inputs. This option appears in the Expression tab after you have added two or more inputs based on readings.
25.
Select the Frequency tab. In the Triggering mechanism section, select when and how the system will trigger the calculation. If the calculation will be triggered at a regular interval (based on a recurrence pattern), define the scheduled interval for the indicator.
For detailed instructions, see Defining an Indicator’s Calculation Frequency.
26.
Select the Auditing tab. To improve product performance, you can control the amount of audit information generated when a reading is created. (The audit information is displayed in the Indicator Reading window, Calculation tab.)
Full auditing – Full information is displayed on the reading’s Calculation tab
Description and input values – The reading’s Calculation tab displays the description and input values in the text field. The table of input values is not displayed
No auditing – The reading’s Calculation tab is not displayed
27.
Select the Candidates tab. On this tab, you can add the standard jobs, standard tasks, and templates that will be displayed to users acknowledging alarms or warnings.
Note: If AssetWise Enterprise Interoperability is active for the site, you can select solutions packages and standard tasks associated with the indicator.
28.
If APM interoperability has been set up to access data in SAP Plant Maintenance, the SAP Corrective Tasks tab is available. Select this tab to browse for SAP objects for reference purposes. You can add maintenance items, maintenance plans, and task lists.
29.
Select the Options tab and the Graphics tab.
30.
Amount of time (for example, weeks, months, years) for which to show indicator readings. When this option is enabled, the Indicator window’s Readings view, Readings tab displays readings for this amount of time, ending with the next reading date. This setting also affects how KPI readings are displayed on dashboards.
31.
On the Options tab, select the Work Orders tab. On this tab you can:
32.
33.
On the Description tab, you can enter a detailed description of the indicator and what it measures.
34.