|
|


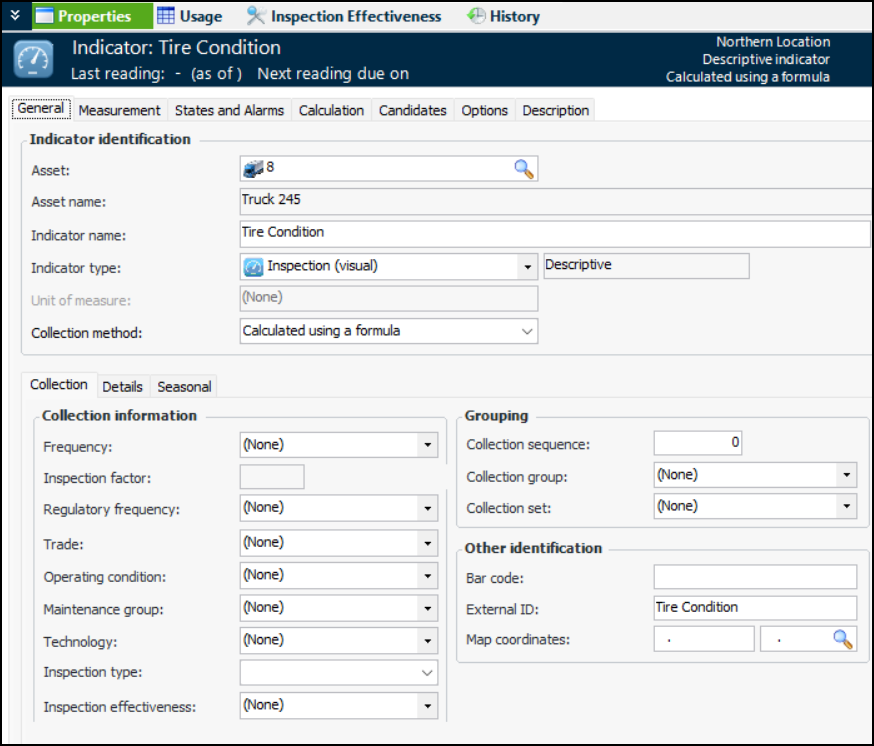
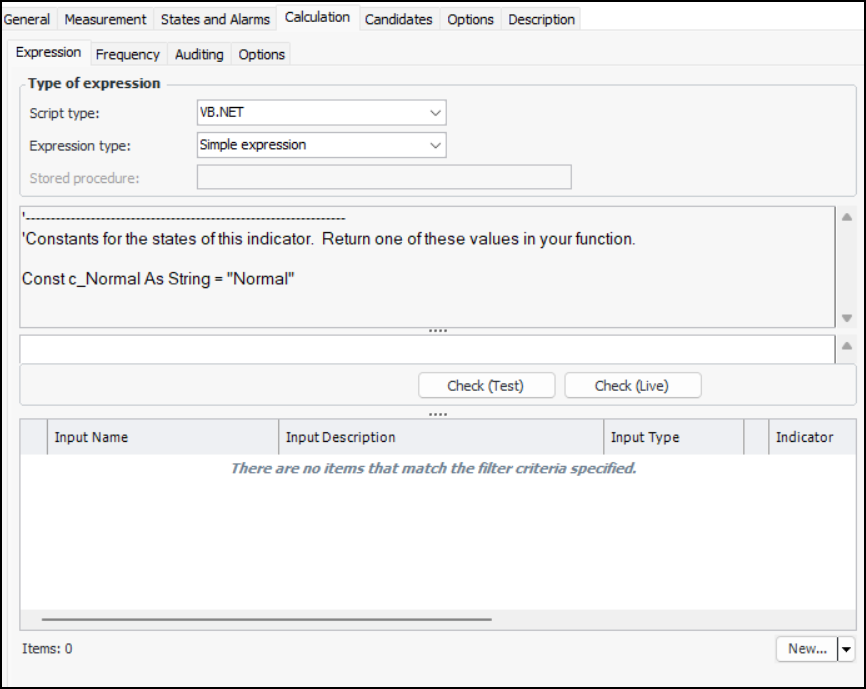
Creating a Calculated Descriptive Indicator
VB.NET and C# Scripts
VB.NET
C#
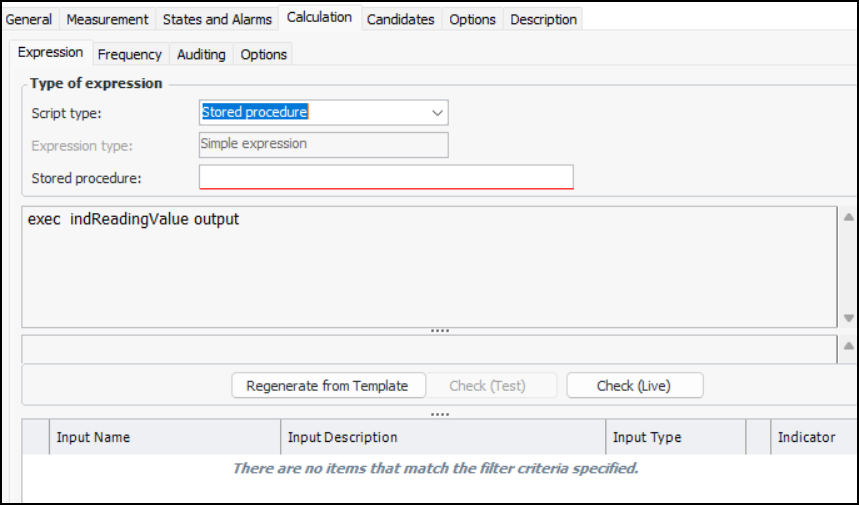
Stored Procedures
This topic explains how to create a calculated descriptive indicator. For more information on using functions in calculated indicators, see Functions and Logical Operators.To Create a Calculated Descriptive Indicator