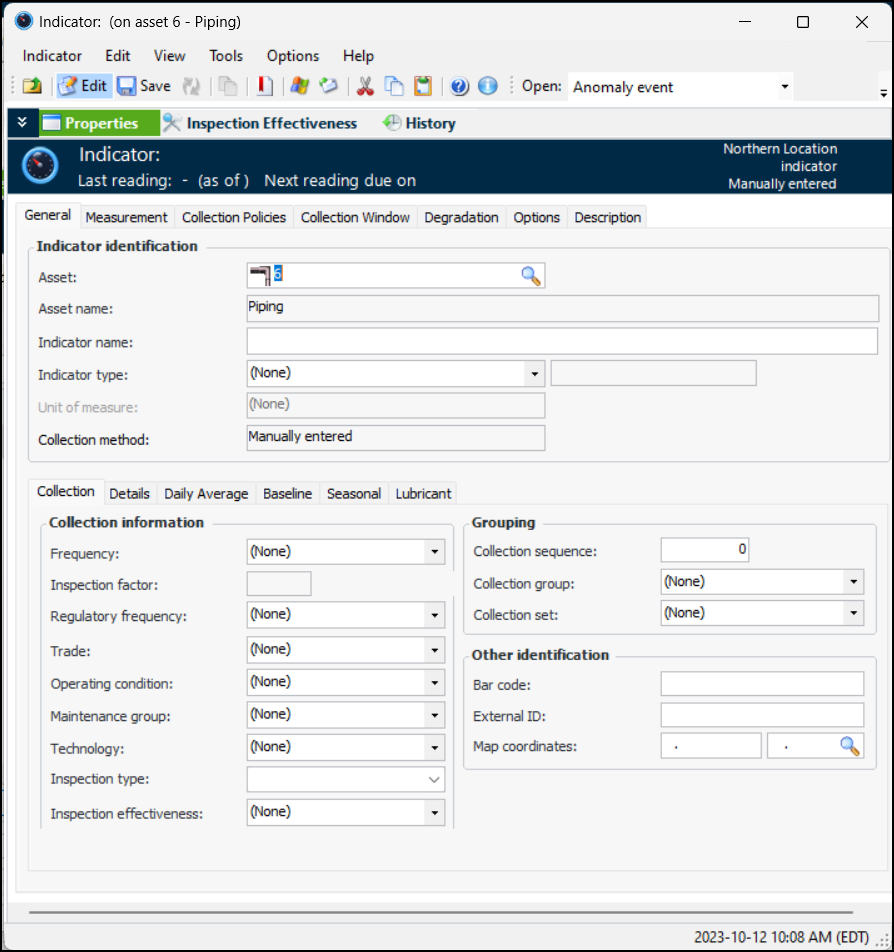
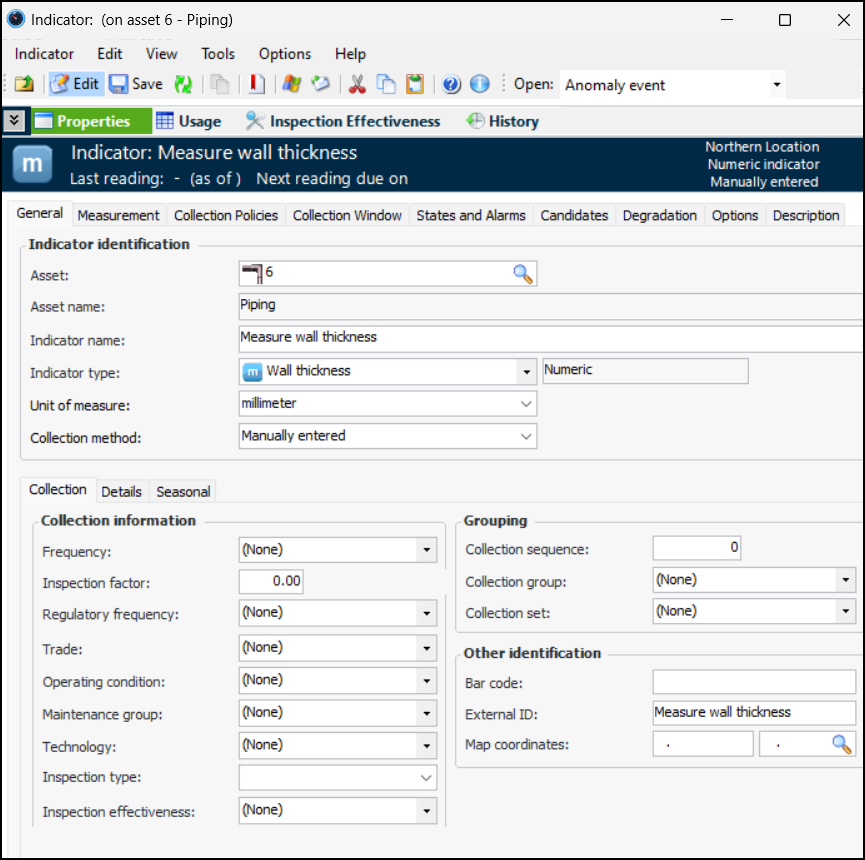
Creating a Basic Numeric Indicator

An indicator is numeric if it records any value within a finite or infinite interval. For example, an indicator that measures temperature or pressure is numeric. Numeric values can go up and down over time. Today’s reading might be either higher or lower than yesterday’s reading. You can count, order, and measure numeric data.
You can set up states and alarms for numeric indicators. Indicator states and alarms can provide additional information to maintenance staff about the meaning of the current value of the indicator.
Numeric indicators can be collected manually or by an online data collection device. You can also create indicators that generate calculated readings based on the readings of other numeric indicators.
Measurement points are supported for manually-entered numeric indicators. Measuring the condition of certain assets such as piping requires taking two or more measurements to arrive at a reliable reading for the indicator. In the case of an indicator that measures the wall thickness of a pipe, four to eight measurements are commonly needed at different locations around the circumference of the pipe. The location on the asset at which measurements are taken is referred to as the Measurement Location, while the points around the asset where the individual readings are taken are called Measurement Points. Once the values for each of the points is recorded, they can be aggregated to derive a value for the Measurement Location. For example, the lowest value might be selected or the average value.
Numeric indicators can also be used to track degradation rates on assets. The degradation rate is used to determine the remaining life (time), remaining degradation allowance (for example, thickness), end-of-life date, and next inspection date for the asset.
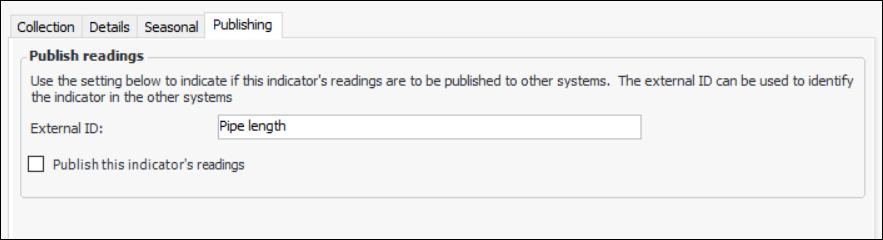
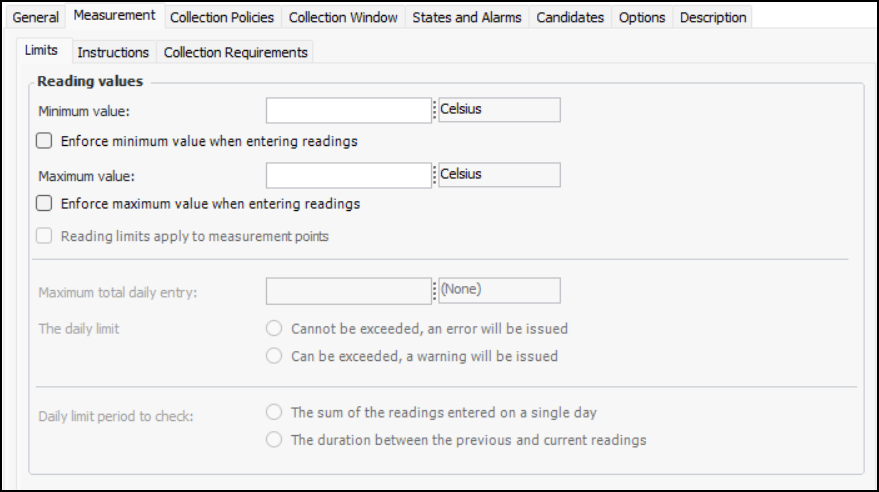
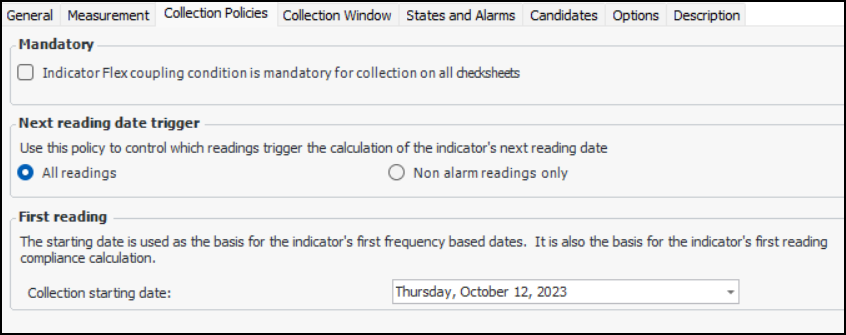
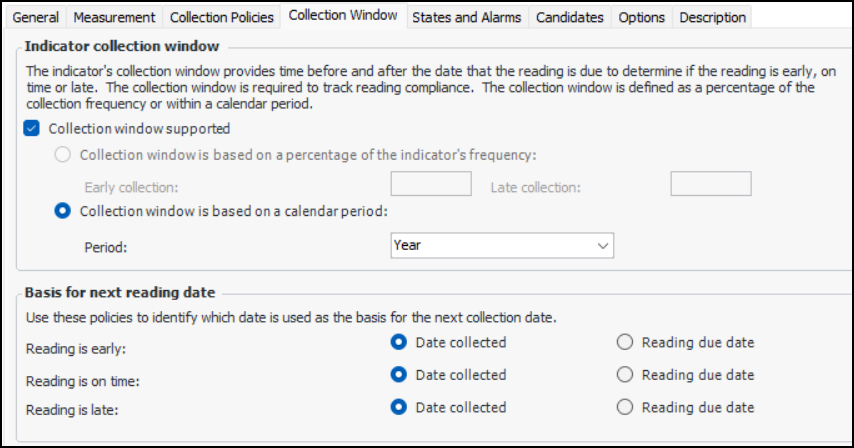
Using the indicator’s collection policies, you can specify how its reading due dates are calculated. You can also set up the indicator’s collection window to define early and late collection periods. You can track collection compliance using table configurations, sidebar dashboards, and KPIs. For information about viewing an indicator’s collection status, see Viewing Indicator Collection Compliance.
Note: Collection policies and windows are not available for rule-based indicators, calculated indicators, cascaded indicators, and indicators collected from an on-line source.
APM supports publishing indicator readings to an external system. When selected readings are processed, APM generates an XML document that can then be consumed by Bentley Enterprise Connection Services, for example, and distributed to another system.
This functionality is supported for all types of indicators. The indicator and its type must have publishing enabled.
Note: The Publish Indicator Readings functionality is generally available. You must first enable feature 92 to use the functionality in APM. In the Enterprise window, select the Features view and the Enabled Features tab. Click Browse, select “Publish indicator readings to an external system” and click OK. If APM is running as a smart client, click Refresh Enabled Features on the server. Then restart the client to use the functionality.
For more information, see Publishing Readings to an External System.
This topic explains how to create a basic numeric indicator from scratch. See the following topics for related information:
Tip: You can also create indicators based on templates. For more information, see Creating Indicators from Indicator Templates.

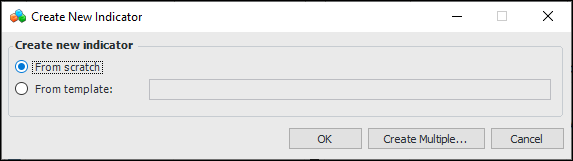
To Create a Numeric Indicator

1.
Open the asset that needs the indicator. Select the Inspection Management view, Indicators tab.
2.
Click New. The Create New Indicator dialog appears.
3.
Select From scratch and click OK.
4.
5.
On the Properties view, General tab:
Select a numeric indicator type from the Indicator type list. When you select a numeric indicator type, the Type of value box says “numeric.”
The window changes to reflect the numeric value type:
6.
7.
Make a selection from the Collection method list.
If they are to be calculated, select Calculated using a formula. The Calculation tab is added. See Creating a Calculated Cumulative Indicator.
8.
On the Collection tab, you can enter values that determine how often readings are expected and the next collection date. You can also enter information to make it easier to select this indicator when adding indicators to a work order task or standard task, when copying indicators to another asset, when setting up dynamic inspection routes, or when implementing reliability programs.
If you are creating the indicator from a strategy development analysis (MTA2, RCM2, RBI, CPR), the searching values (frequency, regulatory frequency, trade, operating condition, maintenance group, and technology) are automatically copied from the associated action plan, if the analysis’ indicator settings allow it. In this case, you need only verify the values.
Note: Any changes that you make to the searching values are not copied to the indicator’s associated action plan.
Review and select values, as appropriate:
Tip: If the technology is linked to an asset type that is used to collect indicator readings, you can identify the measurement device on indicator readings and checksheets.
9.
The target value is displayed on charts and dashboards that show readings for the indicator. In this example, the target line appears as a red dotted line on charts:
10.
To specify the months during which readings should be taken, select the Seasonal tab. Click This indicator is collected seasonally and select the starting and ending dates. For example:
Reading due dates will reflect the seasonal settings.
11.
If the indicator type specifies that lubricant information is available on indicators of that type, the Lubricant tab is available. Select the tab to enter information about the lubricants, such as grease or oil, required for the route.
12.
If the indicator type supports publishing indicator readings, the Publishing tab is available. Select this tab if you wish to publish processed readings for the indicator.
In the External ID box, provide a name to identify the XML file created when the readings are processed.
Select Publish this indicator’s readings
13.
Select the Measurement tab and the Measurement Points tab to set up fixed or variable measurement points. See Adding Measurement Points to an Indicator.
14.
Select the Measurement tab and the Limits tab to set limits on the values that users can enter in readings. For example, if you enter a minimum value of 0.000 Celsius, a user who enters a negative number when recording a reading will receive the message, “The value entered cannot be less than 0.000 Celsius.”
15.
Select Enforce minimum value when entering readings and Enforce maximum value when entering readings, as appropriate.
When minimum and maximum values are enforced, the Reading limits apply to measurement points option is selected by default. You can clear this option to exclude measurement point readings in the limits set on the indicator. In this case, limits apply to the total value of the reading, rather than to individual point readings. This is useful, for example, when the sum of measurement point readings must equal a specific value or range.
16.
Select the Measurement tab and then the Instructions tab.
17.
18.
Select the Collection Requirements tab.
19.
20.
If the indicator type supports subtypes or surveys, you can select the Survey and Subtypes tab to review information. For example:
21.
If the indicator type allows these settings to be overridden on individual indicators, you can clear Use indicator type survey and subtype settings. The default indicator and survey type settings appear on the right as a reference, and you can edit each option as needed. For example:
22.
Select the Collection Policies tab.
23.
24.
All readings – The indicator’s next reading due date is recalculated whenever a reading is processed
Non-alarm readings only – The indicator’s next reading due date is recalculated only when a normal (non-alarm) reading is processed. Select this option if an alarm situation must be resolved and confirmed by a normal reading before regular collection resumes
Tip: On an alarm acknowledgment, you can request a follow-up reading and the time period for collecting it (for example, 10 days). For more information, see Acknowledging Indicator Alarms and Warnings.
25.
26.
Select the Collection Window tab to enable reading compliance tracking. Select Collection window supported to set up reading tolerances.
27.
Collection window is based on a percentage of the indicator’s frequency – Enter percentages in the Early collection and Late collection boxes.
For example, if the frequency is 10 years and you enter 10.00 in both boxes, the early collection period ends one year before the due date. The late collection period begins one year after the due date. The on-time collection period extends from the end of the early collection period to the beginning of the late collection period.
Note: This option is not available if a frequency has not been selected on the General tab, Collection tab.
Collection window is based on a calendar period – Select the period: Day, Week, Month, or Year. The collection periods have the following characteristics:
Day – The early collection date is 00:00:01 on the due date, and the late collection date is 23:59:59 on the due date.
Week – The early collection date is the first day of the week (at 00:00:01) in which the due date falls. The late collection date is the last day of the week (at 23:59:59) in which the due date falls.
Month – The early collection date is the first day of the month (at 00:00:01) in which the due date falls. The late collection date is the last day of the month (at 23:59:59) in which the due date falls.
Year – The early collection date is the first day of the year (at 00:00:01) in which the due date falls. The late collection date is the last day of the year (at (23:59:59) in which the due date falls.
28.
Tip: Readings taken between the early and late dates are considered “on time”. The indicator’s collection status is “Coming due” when the early collection date is in the future but the current date is within the site’s compliance horizon (30 days by default).
29.
Select the States and Alarms tab to add states to the indicator, if required. For more information, see Adding States and Alarms to an Indicator or Template.
30.
Select the Candidates tab.
If APM has been configured to exchange data with an external CMMS using AssetWise Enterprise Interoperability (AWEIS), the Candidates tab displays tables listing solution packages and corrective tasks associated with this indicator. For example:
On this tab, you can suggest standard jobs (APM), solution packages (AWEIS), standard tasks, and templates to users who are acknowledging alarms or warnings. When users acknowledge alarms or warnings for the indicator, APM prompts them with the list so that they can create work orders.
Note: If you are creating the indicator during a strategy development analysis (MTA2, RCM2, RBI, CPR), the action plan’s corrective tasks and jobs are automatically added to the indicator when the action plan is marked “Implementation Completed”.
31.
To add a corrective job (APM), solution package (AWEIS), or task to the list, click Browse. Select the item that you want to add, and then click OK.
32.
If APM interoperability has been set up to access data in SAP Plant Maintenance, the SAP Corrective Tasks tab is available. Select this tab to browse for SAP objects for reference purposes. You can add maintenance items, maintenance plans, and task lists.
33.
Select the i-models tab to link i-models and i-model items. For more information, see Using i-models with Assets and Indicators.
34.
Select the Options tab and the Graphics tab.
35.
Amount of time (for example, weeks, months, years) for which to show indicator readings. When this option is enabled, the Indicator window’s Readings view, Readings tab displays readings for this amount of time, ending with the next reading date. This setting also affects how KPI readings are displayed on dashboards.
36.
On the Options tab, select the Work Orders tab. On this tab you can:
37.
38.
Select the Description tab. Type a detailed description of the indicator.
39.