Creating 4D Calculated Indicators

A calculated indicator has its readings calculated using a formula, rather than entered manually, for example. With the 4D Analytics functionality, the calculations you develop can use readings from 4D or non-4D indicators as inputs. This topic explains how to create calculated 4D indicators.
Note: This topic does not explain features that are not supported by 4D indicators, although those features might be visible in the Indicator window. For a list of the differences between 4D and non-4D indicators, see Introduction to 4D Indicators for Large Data Sets.
For overview information about calculation inputs and more, see Introduction to 4D Calculated Indicators.
Indicators used as inputs in calculations can be numeric, have indicator types that support 4D Analytics, and identify their 4D Analytics connections. You can also use non-4D indicators as inputs, but they will not be able to trigger the calculation as they would in non-4D calculated indicators.

To Create a Calculated 4D Indicator

1.
Open the asset that needs the indicator. Select the Inspection Management view, Indicators tab.
2.
Click New. The Create New Indicator dialog appears.
3.
Select From scratch and click OK.
4.
5.
On the Properties view, General tab:
Select a numeric indicator type from the Indicator type list. The tabs on the window change to reflect the numeric value type. Because the indicator type supports 4D Analytics, the 4D Analytics tab is added on the General tab.
6.
In the Collection method list, select “Calculated using a formula.” The Calculation tab is added to the window. For example:
7.
On the Collection tab, you can enter values that determine how often readings are expected and the next collection date. You can also enter information to make it easier to select this indicator when copying indicators to another asset or when implementing reliability programs.
Review and select values, as appropriate:
8.
Select the 4D Analytics tab and select 4D Analytics is supported for this indicator. For example
9.
In the 4D identification box, enter the connection name for this site.
10.
11.
Select the Calculation tab.
12.
On the Expression tab, select the type of expression. A calculated indicator can be based on:
VB.NET – Inputs and functions defined on the Calculation tab can be used to create a formula that is calculated at run time. This is the default option
C# – Inputs and functions defined on the Calculation tab can be used to create a formula that is calculated at run time
Stored procedure – The expression is provided in a stored procedure that receives its inputs at runtime and returns a value
13.
With the Complete class option, a starter script template is provided automatically, which you can edit as needed. You can also click Regenerate from Template to reset the formula to the starter script.
The template scripts include DebugData statements that you can augment to output trace messages when the Check (Test) or Check (Live) method is invoked to test the calculation.
Tip: You can view the template scripts by opening the Enterprise window, clicking the Administration menu and then Calculation options. For more information, see Defining Calculation Options.
14.
If you are entering a function, see Using Logical Operators and Functions.
If you are using a formula, you can use three elements:
Example:
To enter a calculation that takes the average of two indicators, you would type:
(Indicator1 + Indicator2) / 2
The variables “Indicator1” and “Indicator2” are placeholders for data from asset indicators. When the calculation is evaluated, APM gets the current values of the indicators.
15.
Provide the name of the stored procedure.
16.
From the New list, select either Indicator Input or Filter Input. The Calculation Input dialog appears. Here is an example for an indicator input:
For detailed instructions on creating each type of input, see the following topics:
17.
Click OK when you have finished creating the input. The Calculation Input dialog closes and the input is added to the table of inputs.
18.
For VB.NET and C# expressions, you can check the syntax (the order of the elements) of your calculation by clicking Check (Test) on the Expression tab. APM looks for errors in how you typed the calculation. In addition, the system uses the test values on the inputs to complete a test calculation. You can use the result of this calculation to check that the expression is giving the desired results.
19.
For 4D calculated indicators, you can use Check (Live) to test the calculation by retrieving input values from the Influx database, based on the date and time you specify. Here are two tips for determining the dates for input readings:
Click 
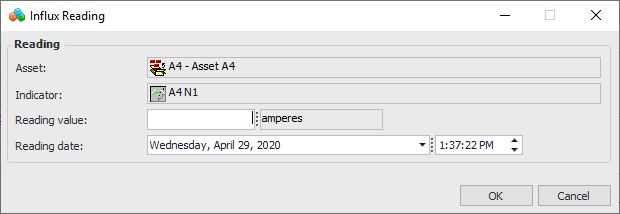
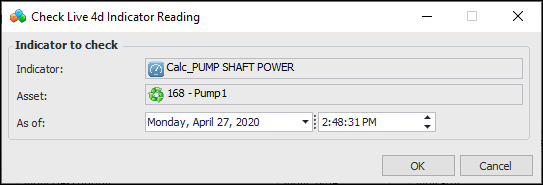
to open chart details. Select View as Table to see a list of readings, along with their time tags and values. Note the date and time that you wish to use in the live test
Create Influx readings for each of the input indicators. Open each input indicator, click the Tools menu and then New Influx Reading. The Influx Reading dialog appears. For example:
Enter a reading value, date, and time. Click OK. You can then use the date and time in the test.
20.
Click Check (Live). The Check Live 4D Indicator Reading dialog appears, showing the current date and time. For example:
Select the appropriate date and time and click OK.
The calculation is performed using readings with timestamps that match your request. If exact matches cannot be found, readings with the closest date/time values are used. The Test Reading dialog shows the result of the calculation in the Value collected boxes:
Select the Calculation Input Values tab to see the individual input values. If the calculation formula includes DebugData statements, the Debug Statements tab shows the result.
Click Close when you are finished.
21.
Ensure that the parameters in the stored procedure match the input names and that the procedure includes a return value parameter.
22.
If necessary, you can change the Required Proximity of the calculation inputs. This option appears in the Expression tab after you have added two or more inputs based on readings.
23.
Select the Frequency tab. In the Triggering mechanism section, select when and how the system will trigger the calculation.
Note: We recommend using the default selection Whenever a new reading is entered for one of its input or whenever a reading is entered for another input.
Indicator frequency based on a regular interval using a recurrence pattern is not recommended. The Execute 4D Analytic Calculations scheduled action will not generate readings. The Recalculate Calculated Indicators scheduled action will generate readings in APM for 4D calculated indicators, but the readings will not be added to InfluxDB and you will not see them in the 4D chart.
24.
25.
On the Description tab, you can enter a detailed description of the indicator and what it measures.
26.