|
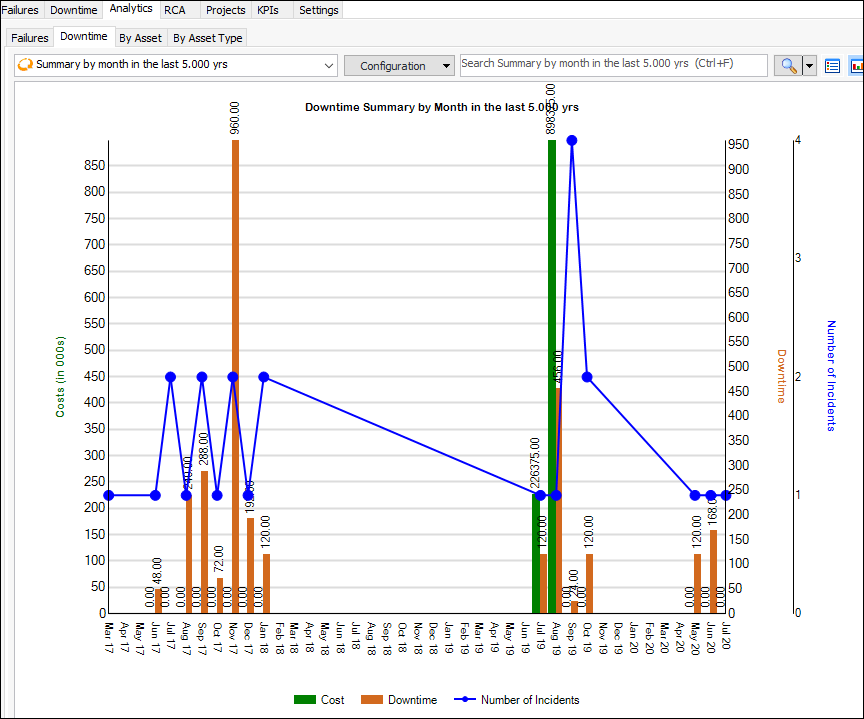
Viewing Downtime Incidents
You can view downtime incidents and related statistical information from the site’s Performance Management view, Downtime tab or from the asset’s Performance Management view, Downtime tab. You can also view downtime incidents that are associated with failure records.Note: Only assets that support downtime incidents have Downtime tabs.To View Downtime Incidents
1. From the Site window, select the Performance Management view, Downtime tab. The default “Downtime” configuration lists incidents by start date, sorted in descending order. You can also select the “Downtime - details” or “Waiting to be reviewed” configuration.
2.
3. Choose from configurations on the Downtime tab to view summaries by month, week, or reason, as well as production loss accounting.Tip: You can adjust the data and chart appearance by opening the configuration, selecting the Appearance tab and then the Chart tab.
4. Select the By Asset tab to view the site’s assets. Select an asset to view its failures and downtime incidents.Tip: You can also open an asset, select its Performance Management view and Downtime tab to view this information.
5. Select the By Asset Type tab and select an asset type in the tree to view failure avoidance savings and downtime incidents for assets of this type.