|
|


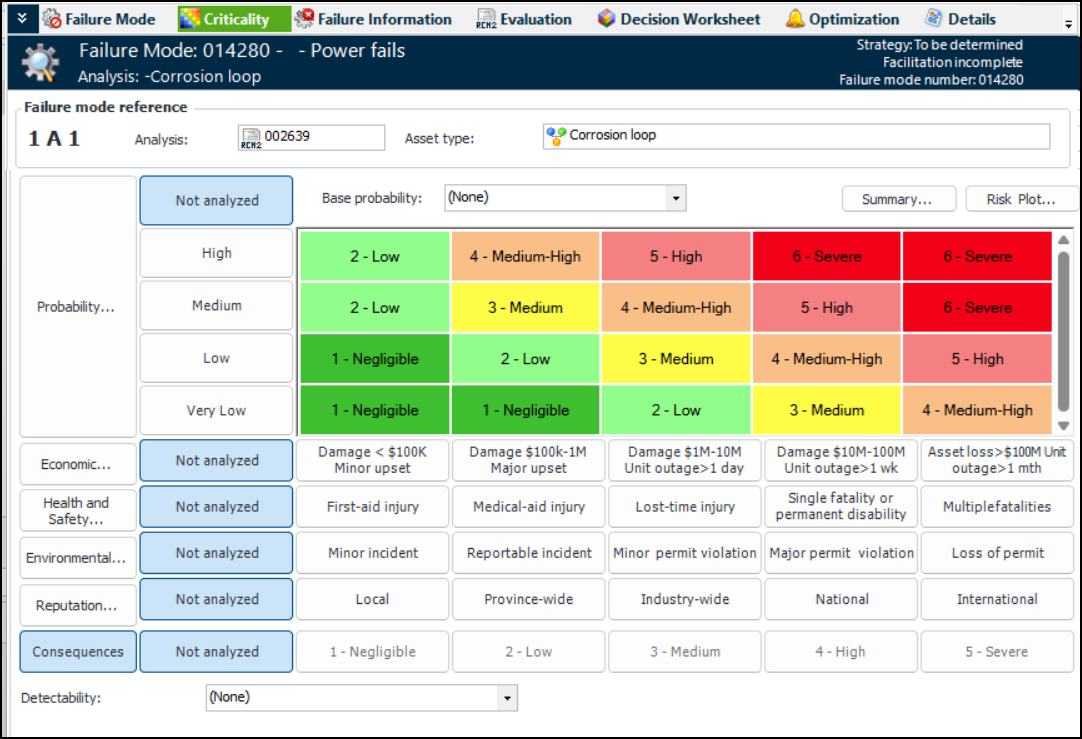
Performing Design FMECA Failure Mode Risk Analysis
After you have analyzed the failure modes, you can compare failure modes and identify the relative importance of addressing them. The Risk Assessment view in the Strategy Development Analysis window includes failure mode lists based on criticality, consequence priority, severity, and relative risk, as well as a risk plot, risk matrix, and lists of the evaluations.For instructions on using the simpler evaluation with weighted severities, see Performing Design FMECA Risk Analysis with Weighted Severities.Note: Before you can perform risk analyses, the severities, probabilities, and risk matrix entries must be set up in the site’s risk analysis settings. If you are using evaluations forms, they must also be set up. For more information, see Setting up APM for Design FMECA.
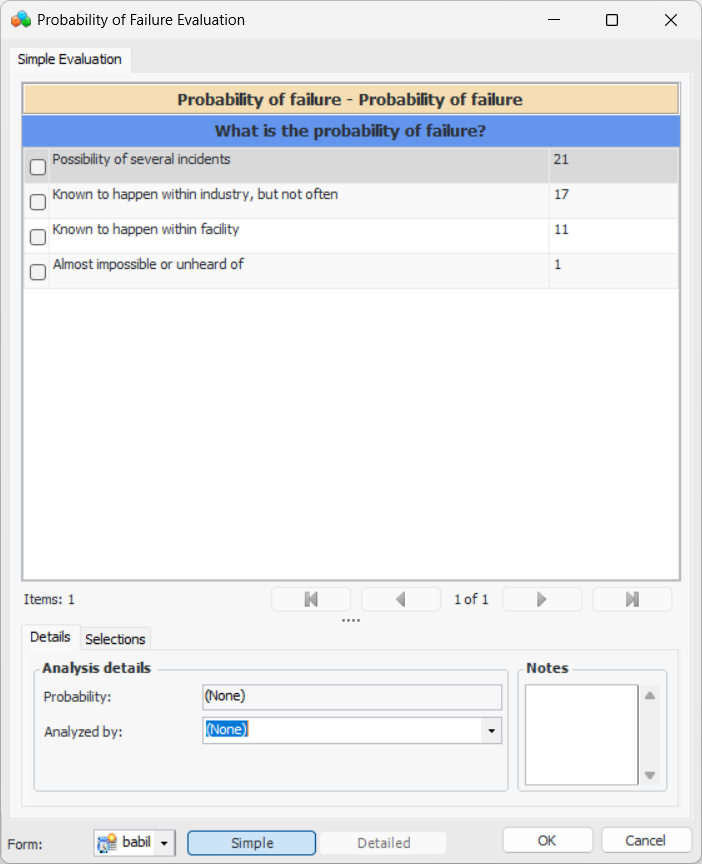
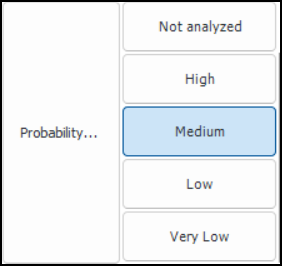
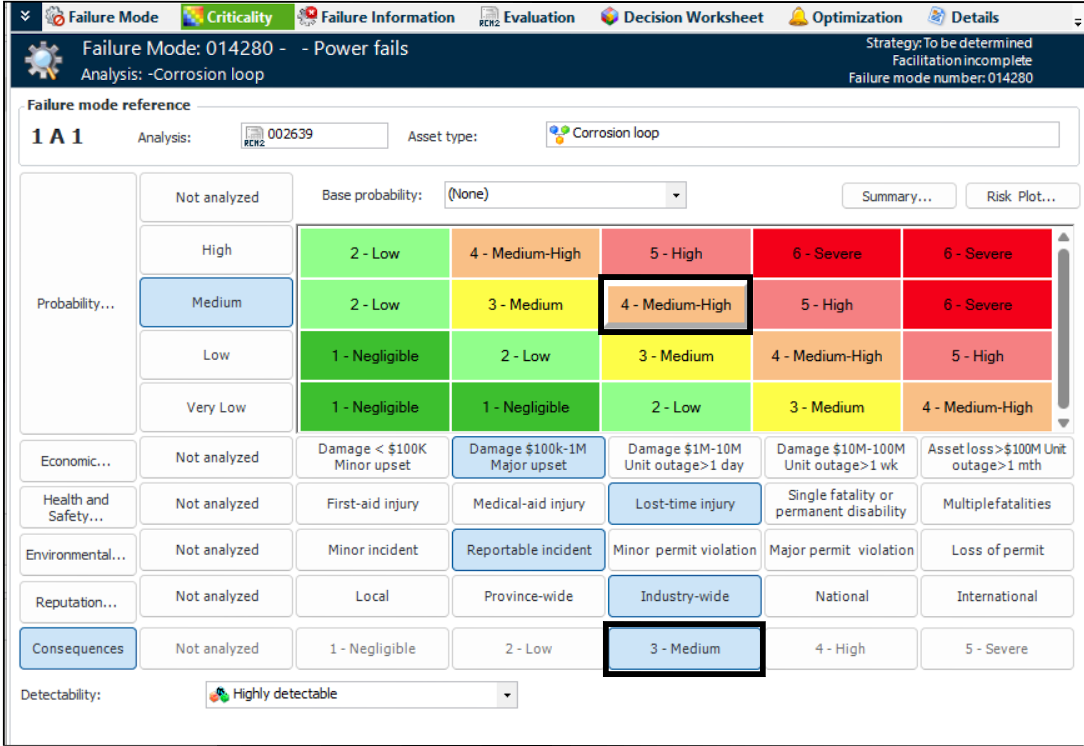
To Evaluate the Probability of Failure
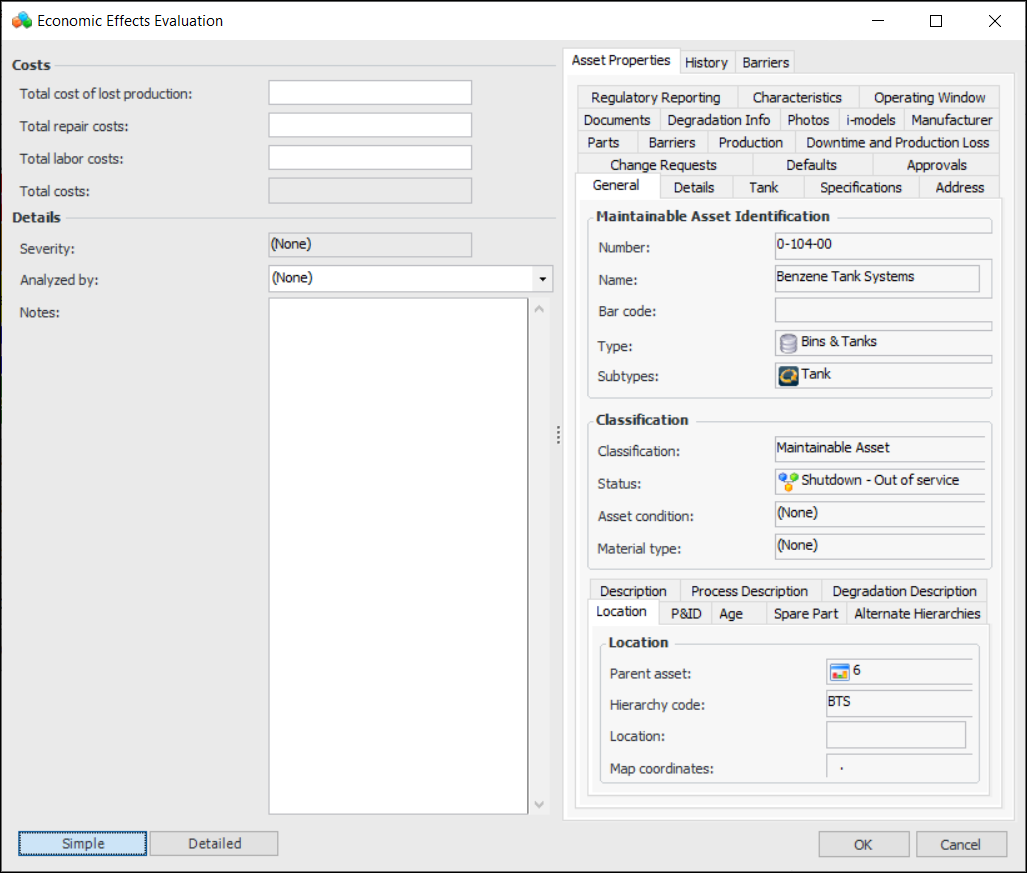
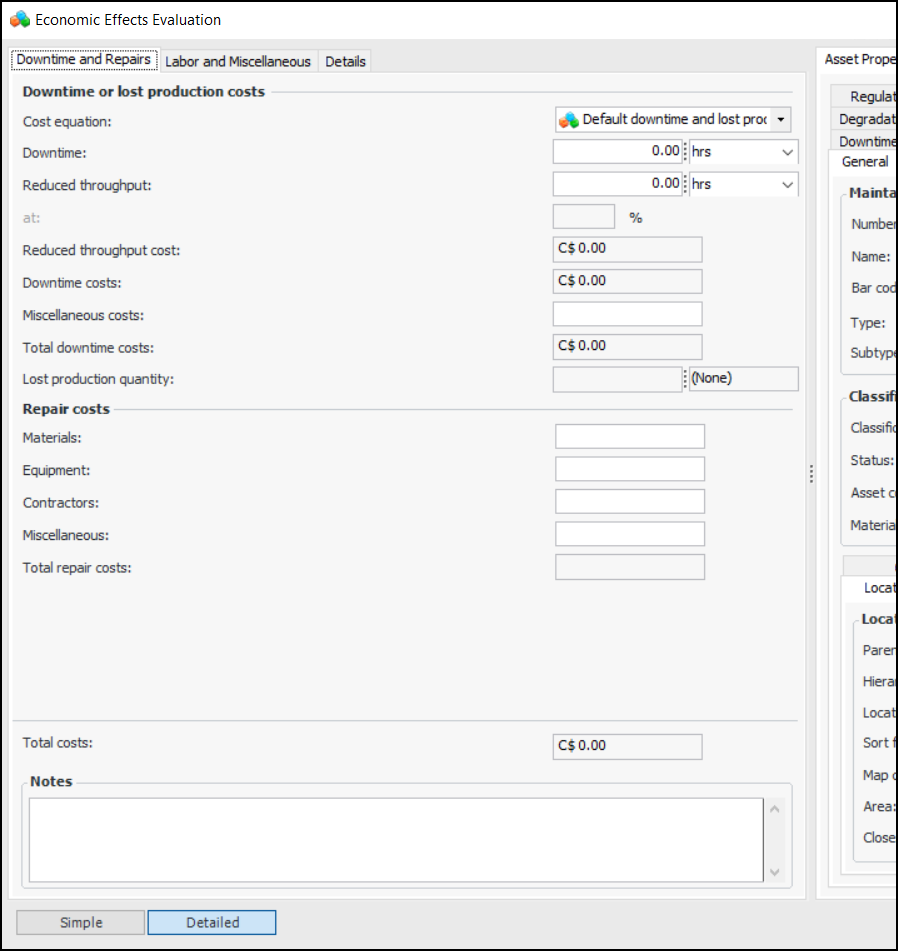
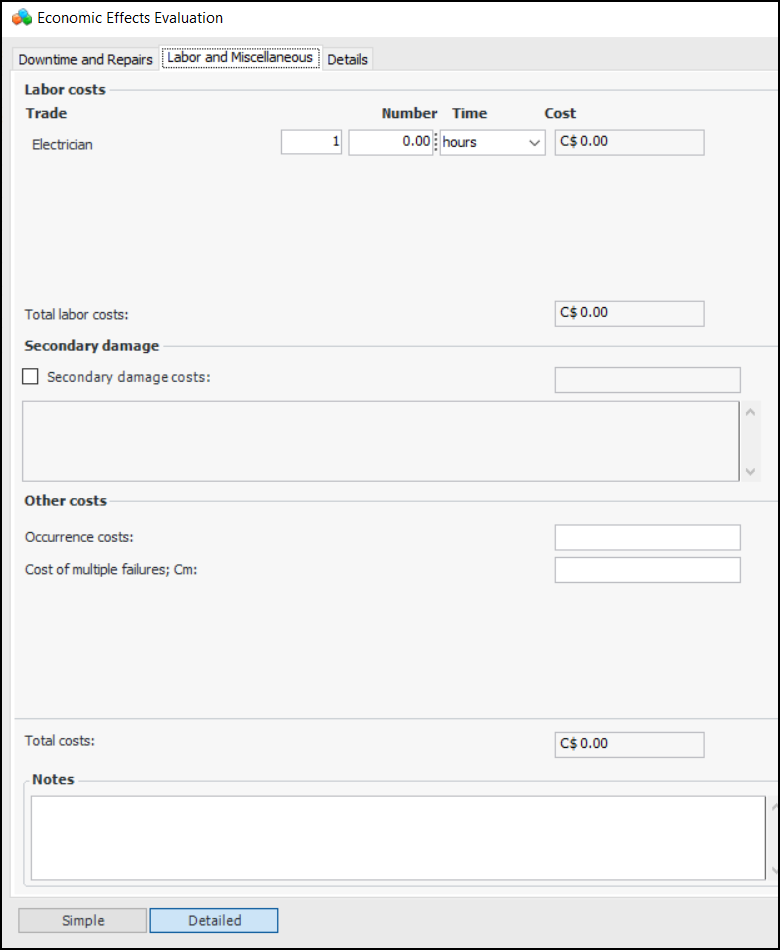
To Evaluate Economic Effects of Failure
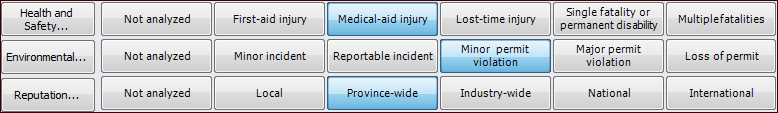
To Evaluate Health & Safety, Environmental, and Reputation
To Assign a Detectability Value
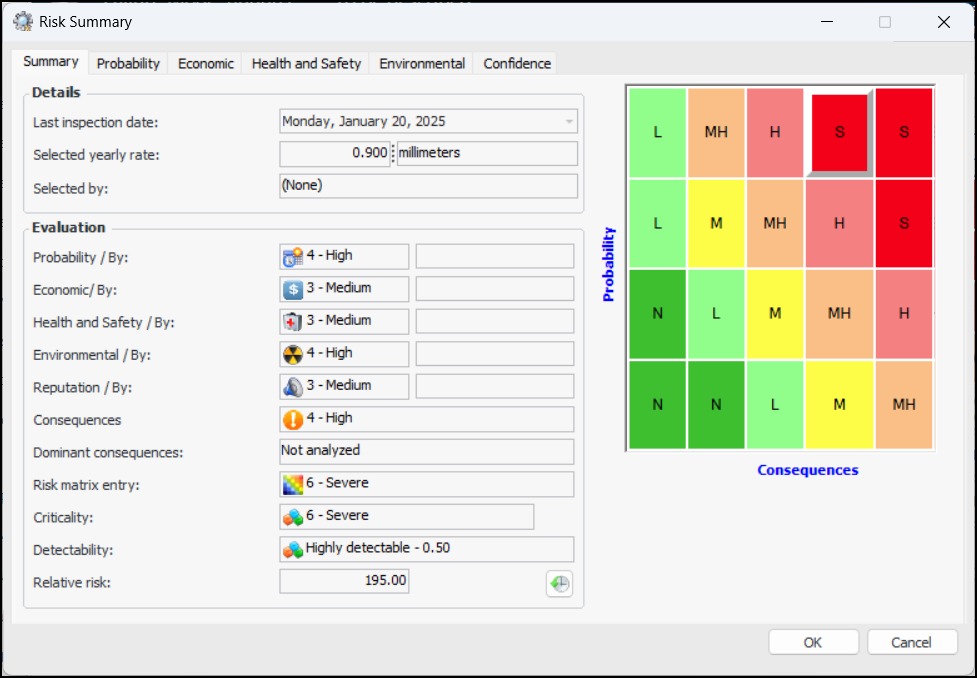
Viewing the Risk Analysis Summary
 is enabled.