|
|


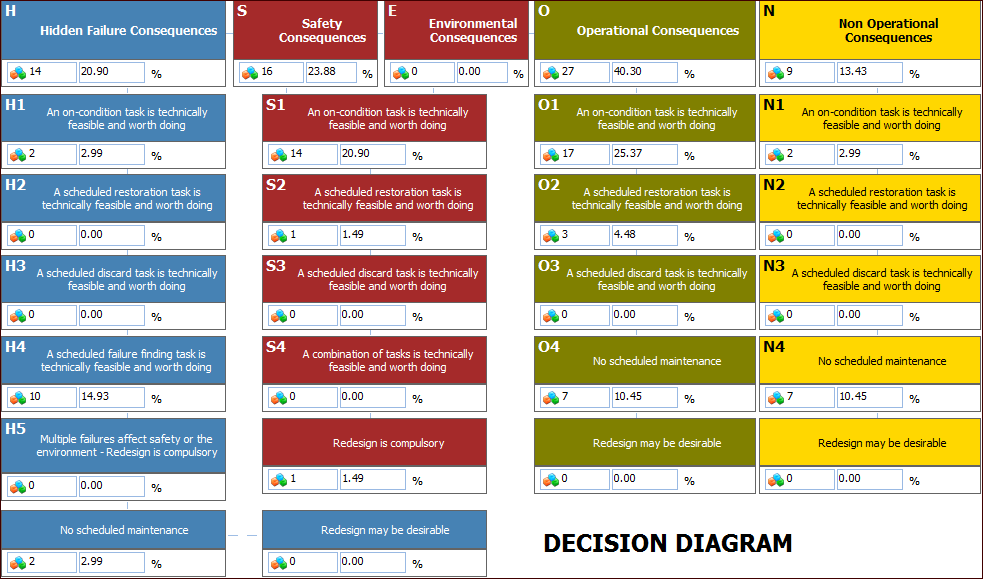
Viewing the Decision Diagram for a Design FMECA
In the Strategy Development Analysis window, the Decision Diagram view displays a graphical representation of the results of the analysis. The diagram contains 27 decision boxes, each representing the answer to a specific question or series of questions associated with the failure mode evaluation. Included in each box is a count of the failure modes that answered the questions positively and the percentage that the count represents of the number of failure modes analyzed.Tip: You can print the decision diagram. Click the Analysis menu, Print, RCM2, and then Decision Diagram. For more information, see Printing Design FMECA Reports.