Defining Variable Graph Appearances for a Chart

You can set options to determine how the table configuration looks and how you can manipulate data in it. Formatting options include displaying gridlines or headings, allowing users to edit data in the table or create new records from the table, and including all records above or below the current level in the hierarchy. You can also set options for exporting the configuration to a Microsoft Excel® spreadsheet.
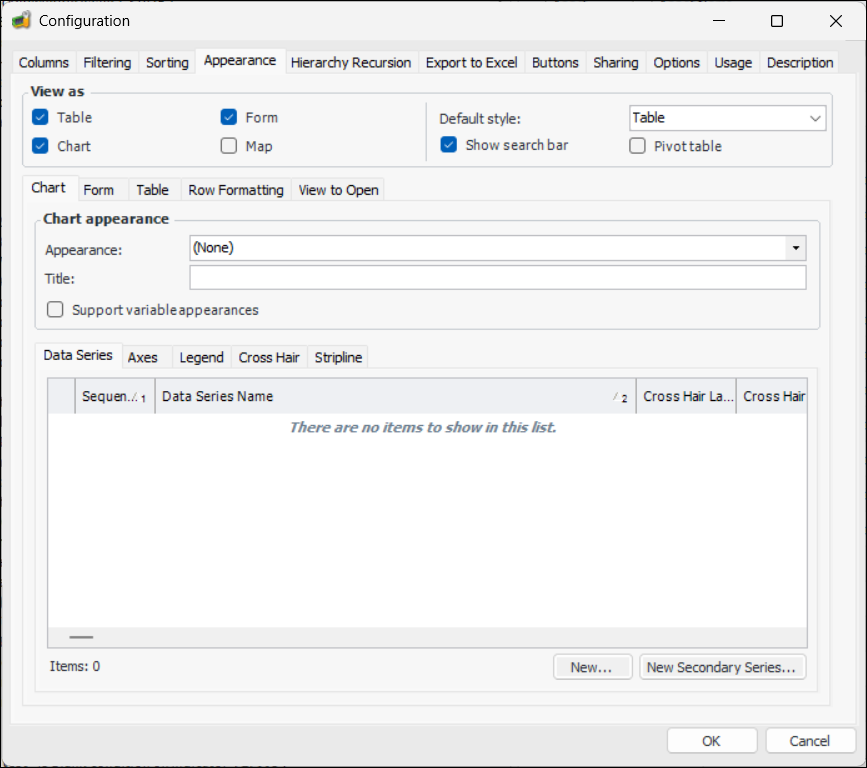
APM allows you to define multiple data appearances controlled by whether you have selected to support variable graph appearances. For example, you can define different versions of charts for each asset health calculation on an asset health report.
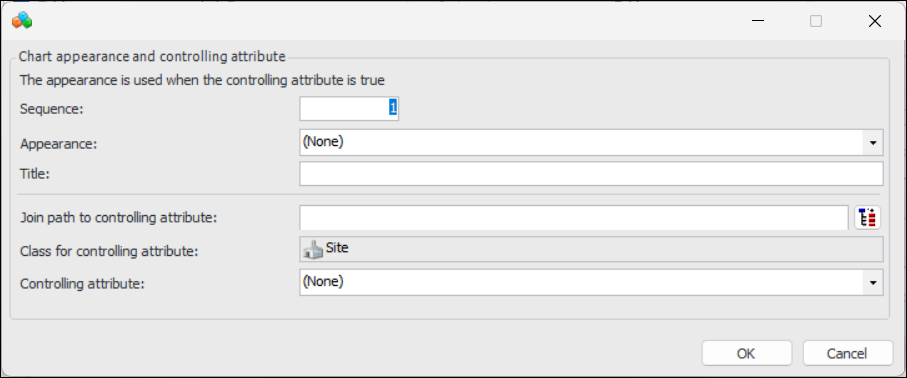
If support for variable chart appearances is selected, APM examines in sequential order, each of the graph properties appearances that you have defined in order to determine which appearance will be used, based on whether the controlling attribute is true. If a controlling attribute is true, its custom appearance is used, otherwise the default graph properties are used.
Note: It is the designer’s responsibility to ensure that only one controlling attribute is true and that the appearances are properly ordered.
This topic describes how to define variable graph appearances for a chart.

To Define Variable Graph Appearances for a Chart

1.
2.
Click Configuration and then Open. The Configuration dialog appears, open to the Columns tab.
3.
Select the Appearance tab. Select Chart in the View as area:
4.
Select Support variable appearances in the Chart appearance area. The Appearances tab becomes available.
5.
Select the Appearances tab.
6.
Click New to create a new graph properties appearance.
7.
8.
Click OK to save the settings and close the dialog.
9.
Repeat steps 6 to 8 for each graph appearance you wish to define.
10.
Click OK. The table is now updated to reflect your changes.