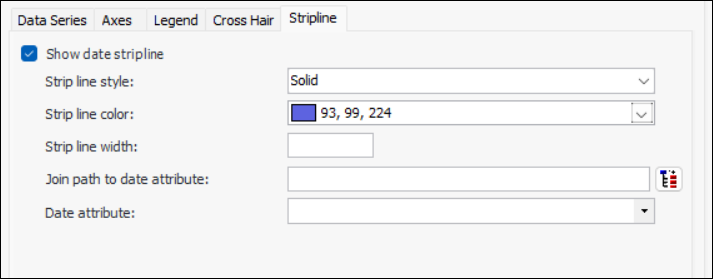
Concepts Tasks Defining a Stripline for a Chart You can display a date stripline on a chart to highlight areas of interest. You can define its properties such as line color, width, and style. You can also select a join path to the date attribute. This topic describes how to define stripline properties for a chart. To Define a Stripline for a Chart 1. Open the table configuration that includes the chart for which you want to define a stripline. 2. Select the Appearance tab, the Chart tab, and then the Stripline tab. 3. Select Show date stripline and then adjust the strip line style, color, and width to suit your preferences. For example: 4. Select a join path to date attribute and the date attribute.