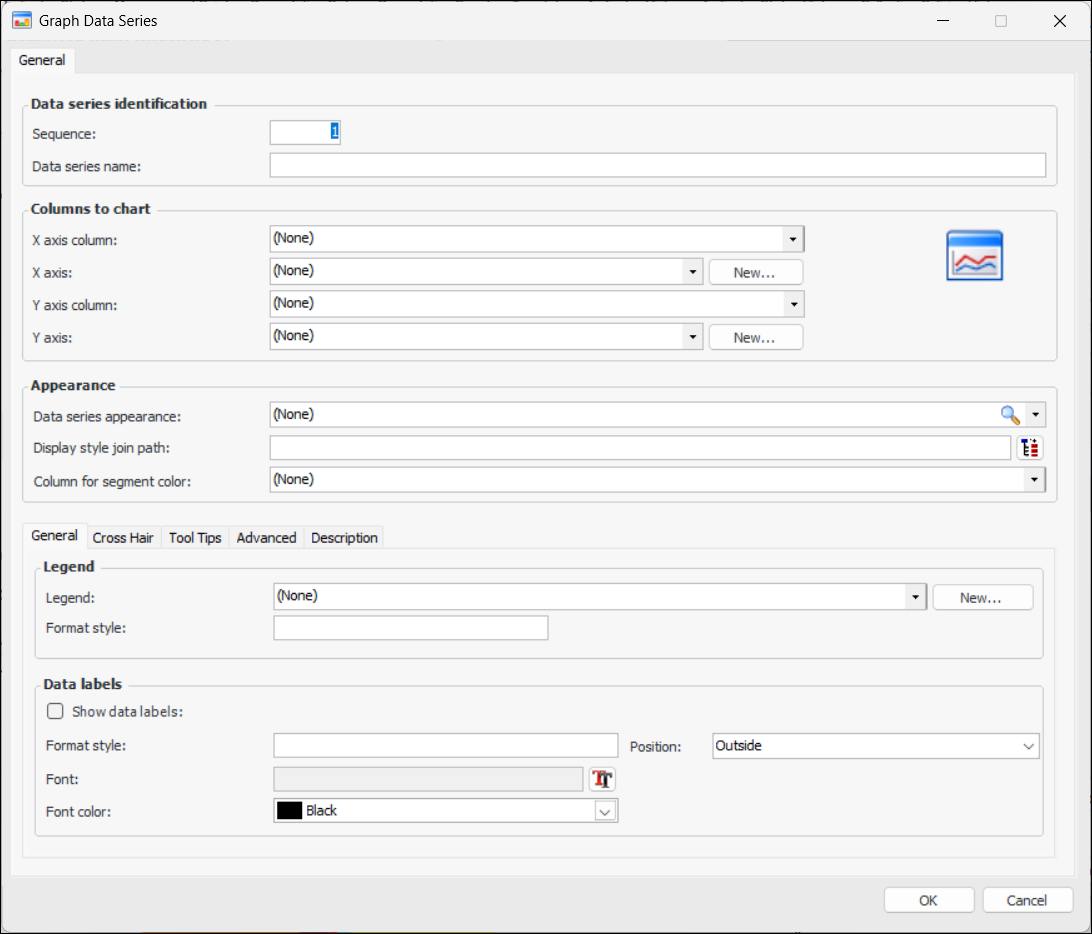
Defining Custom Data Series for a Chart

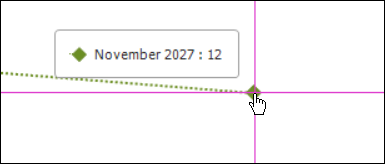
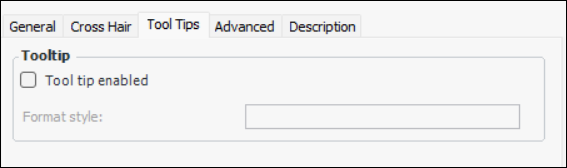
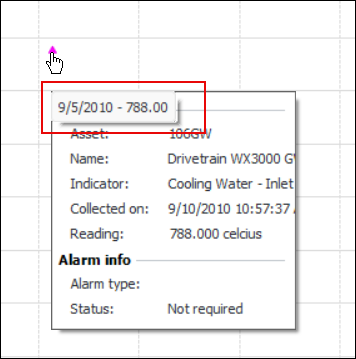
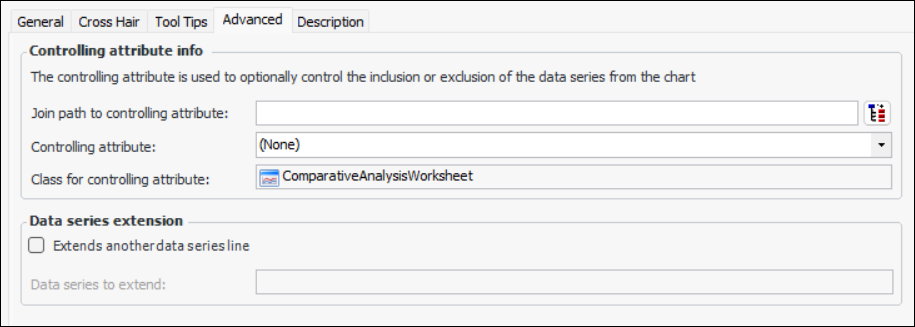
In APM, you can define custom data series for charts by determining the columns to chart, appearances of the data series, legend, and tooltips, as well as other advanced features.
As the components of the data series are defined, a thumbnail representation of the chart is updated. For example:
This topic explains how to define custom primary data series for a chart. You can also create a secondary data series for the chart. For more information, see Defining a Secondary Data Series for a Chart.

To Define Custom Data Series for a Chart

1.
2.
Select the Appearance tab, then the Chart tab, and then the Data Series tab.
3.
Click New. The Graph Data Series dialog appears.
4.
5.
6.
In the Columns to chart area, select the X axis column from the list of columns in the table.
7.
Select an X axis from the list or click New to create a new X axis. For more information about creating an axis, see Defining an Axis for a Chart.
8.
9.
Select a Y axis from the list or click New to create a new Y axis. For more information about creating an axis, see Defining an Axis for a Chart.
10.
In the Appearance area, select a data series appearance from the list.
11.
12.
13.
On the General tab, in the Legend area, you can specify a legend for the data series. Click New. For information about creating a legend, see Creating a Legend for a Chart.
14.
In the Format style box, enter a DevExpress® text pattern for the data series legend. Patterns can contain regular text and value placeholders in braces. To format numeric and date/time values, you can apply format specifiers. Use a colon to separate a placeholder and its format specifier.
Available placeholders are:
{A} argument
{V} value
For more information, see DevExpress Format Specifiers.
For general information, see Format Text Chart Elements.
15.
In the Data Labels area, select Show data labels to include labels for the chart’s data.
16.
In the Format style box, enter a DevExpress text pattern for the labels.
For example:
{A:d} - {V:F2}
where
{A:d} is the date
{V:F2} is the value with two decimals
The result is
The position is “Outside”, but “Centered” is also supported.
Patterns can contain regular text and value placeholders in braces. To format numeric and date/time values, you can apply format specifiers. Use a colon to separate a placeholder and its format specifier.
Available placeholders are:
{A} series point argument
{V} series point value
17.
18.
Select the Cross Hair tab.
19.
Click Cross hair label visible.
20.
In the Format style box, enter a DevExpress text pattern to generate the cross hair label displayed on the graph data series. For example:
{A:d} - {V}
displays as:
Note: Cross hairs are not supported for pie or donut charts.
21.
Select the Tool Tips tab.
22.
Click Tool tip enabled.
23.
In the Format Style text box, enter the DevExpress® text pattern string that defines what is displayed in the tool tip. For example:
{A:d} - {V:F2}
{A:d} is the date
{V:F2} is the value with two decimals
The result is:
24.
Select the Advanced tab.
25.
26.
To have this data series extend another data series in the chart, select Extends another data series line and then select the data series from the list.
27.
Select the Description tab to enter a description for the data series.
28.
29.
Repeat steps 3 to 28 for each data series you want to define.