Overview of Dashboards

A dashboard displays summarized information, often in chart form, for reference, analysis, and comparison. There are three types of dashboards: site, sidebar, and My desk.
Site dashboards are used to group and display performance indicators, comparative analyses, asset health indexes, and site information. For example, dashboards can show the current values for a group of key performance indicators or graphically trend indicator readings over a period of time. A site dashboard can have up to four sections, each displaying different information.
A sidebar dashboard consists of charts or gauges that appear at the side of a window to summarize the information in it. A sidebar dashboard contains one section that can show site panels (typically charts) or KPI gauge panels.
“My desk” dashboards provide employees with information that is relevant to them or to their roles. For example, employees with the role of Planner might be assigned a My desk definition that shows the work orders, work requests, and reliability programs assigned to them. My desk definitions can consist of 1-4 sections, and each section can display site or KPI panels.
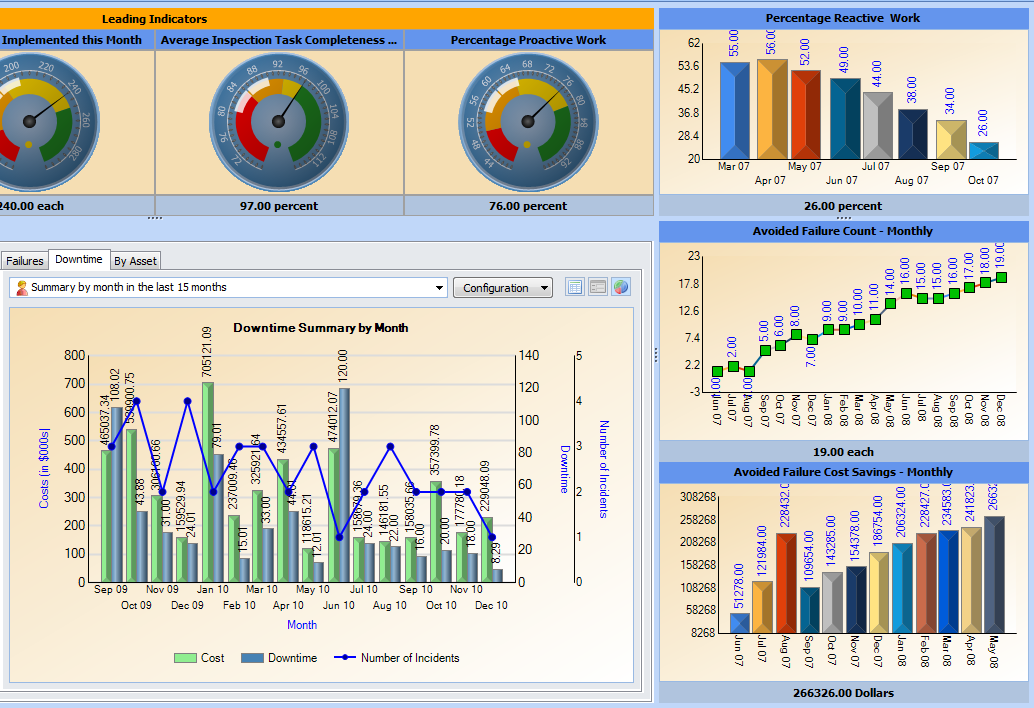
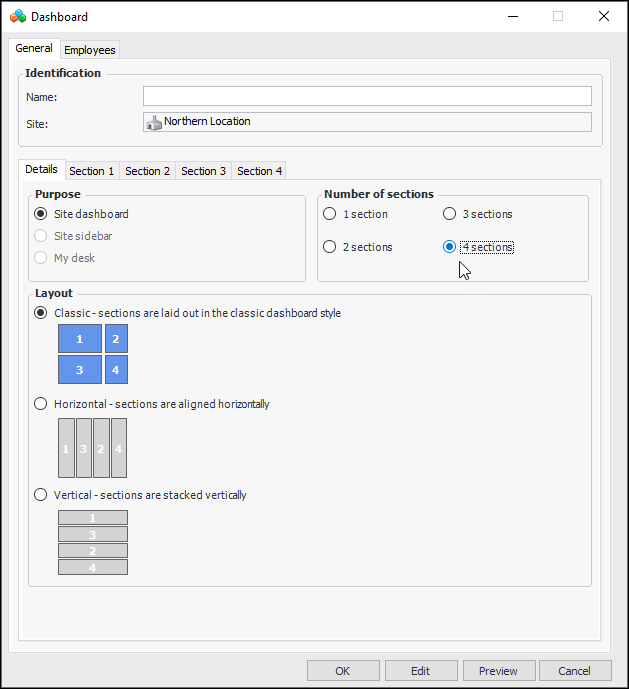
All types of dashboards are assigned to APM users in their employee records. Site dashboards appear in the user’s Dashboard view. The user’s assigned sidebar dashboards can appear throughout the product, for example, on the Assets view, Listing tab. Standard sidebar dashboards can also appear on object windows, for example, in the Asset window’s Strategy Development view. My desk dashboards appear in the user’s My Desk view.
A list of predefined panels is available to select from when you are setting up a dashboard to use a site panel, KPI panel, or AHI panel. Examples of these panels are “Dashboard - Degradation rate summary - by indicator”, “My desk - Planner panel”, and “KPI gauges panel - Aligned horizontally”. (If the dashboard section displays KPI or AHI panels, you would also select the indicators or indexes to show in the panel.) It is also possible to create custom panels to show in dashboards, as well as copying existing dashboards by using the Customization Center. For more information, see Customization Guide.

Site Dashboards

Site dashboards are used to group and display performance indicators, comparative analyses, asset health indexes, and site information. For example, dashboards can show the current values for a group of key performance indicators or graphically trend indicator readings over a period of time. A site dashboard can have up to four sections, each displaying different information.
Here is an excerpt from a site dashboard, which is viewed in the user’s Dashboard view:
When designing dashboards with two or more sections, you have a choice of layouts. The options are:
The Dashboard dialog illustrates the layouts. For example:
Site dashboards can be set up at the site level, in which case they are available to child sites. They can also be set up at the enterprise level using the Customization Center (select the User Interface tab and then the Dashboards tab). These dashboards are available to all sites in the enterprise.

Sidebar Dashboards

A sidebar dashboard consists of charts or gauges that appear at the side of a window to summarize the information in it. Sidebar dashboards can show site panels (typically charts) and KPI gauge panels. Here is an excerpt from a sidebar dashboard on a site’s Strategy Development view:
Defining site sidebar dashboards gives you control over showing and hiding some or all sidebars for individual employees. Sidebars are assigned to APM users in their employee records.

Dashboard Sets

A dashboard set identifies the dashboard definition to display in each of the places where a sidebar is supported.
The following table lists the settings in a typical dashboard set (APM standard sidebars), the locations where sidebar dashboards can be displayed, and examples of the panel to show for each location.

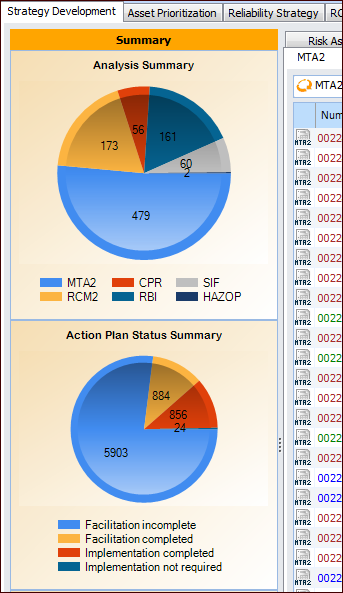
Sidebar Dashboards on Object Windows
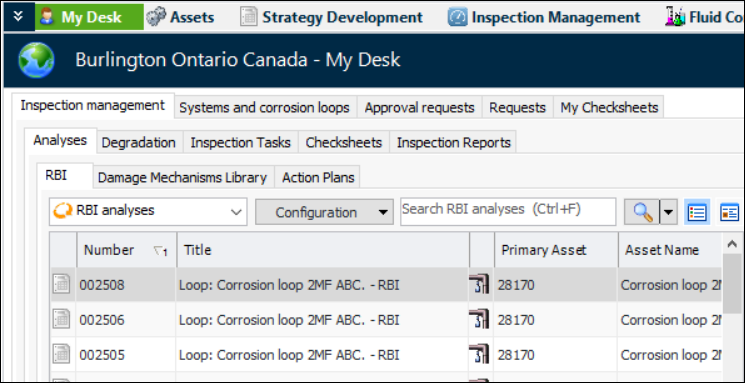
Standard sidebar dashboards can also be displayed on windows for individual assets, strategy development analyses, and asset prioritization analyses. The following table lists the windows where sidebar dashboards can be displayed.
The set’s definition determines which object windows, if any, display sidebar dashboards.
The employee record contains a reference to a dashboard set, thus allowing you to select the sidebar dashboards displayed for each employee. Typically, the same sidebars are displayed or hidden for groups of employees.

My Desk Dashboards

The My Desk view provides employees with information that is relevant to them or to their roles. For example, employees with the role of Planner might be assigned a My desk definition that shows the work orders, work requests, and reliability programs assigned to them. Here is an excerpt from a My Desk view that shows information for an inspection engineer:
APM comes with several predefined My desk definitions and sets, which you can modify for your organization. You can also create your own.
My desk definitions can consist of one to four sections, and each section can display site or KPI panels. The following predefined, role-based site panels are available for My desk definitions:
When you have created My desk definitions, you can define one or more My desk sets. For each set, specify the definitions to show and their order, and assign the set to one or more employees.
My desk definitions are set up in personnel settings. For information about creating My desk dashboards, see Setting up My Desk Views.