|
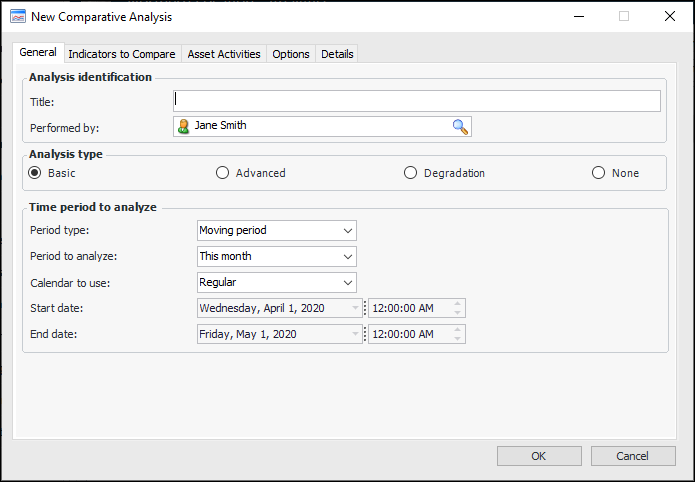
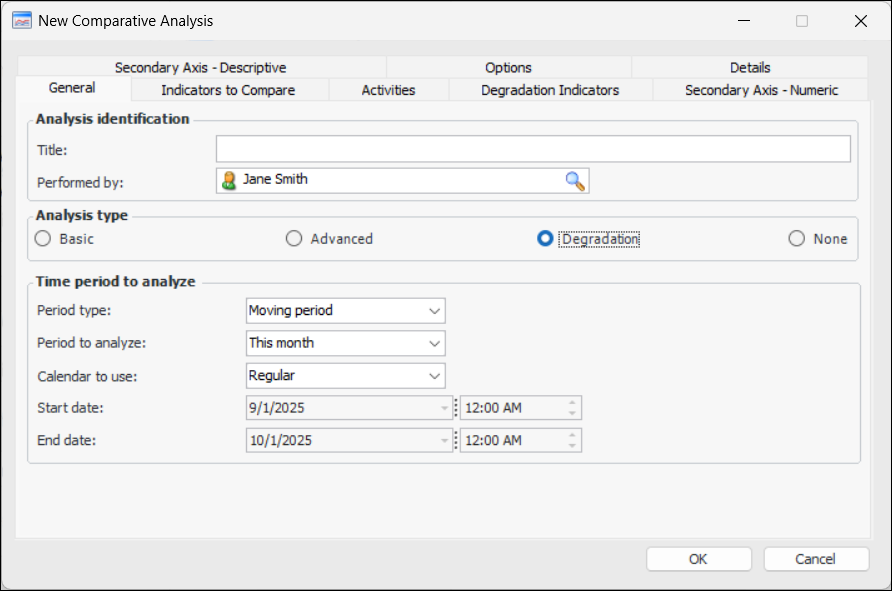
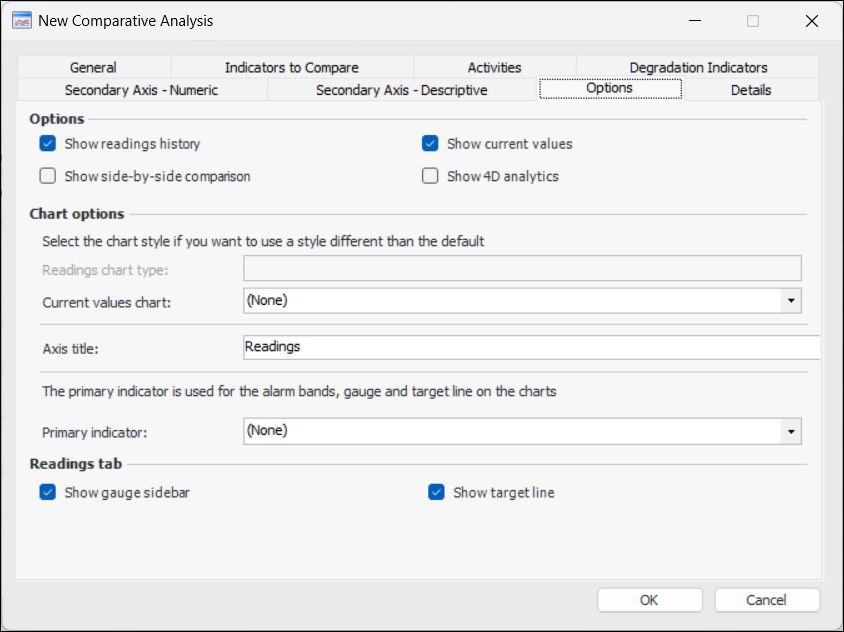
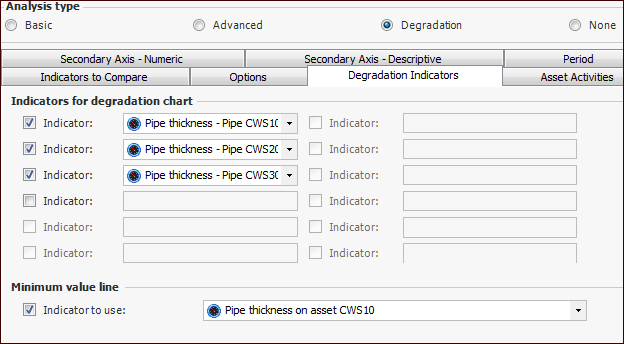
Creating a Degradation Comparative Analysis
Tip: Comparative analyses can also be created from a failure mode in a risk-based inspection analysis. In the Maintenance Action Plan window, select the Degradation Rates view and the Comparative Analyses tab and click New. This feature is not available for failure modes created for the damage mechanisms library.
• Axis title1 Yes2 Yes3
To Create a Degradation Comparative Analysis
1. In the Site or Asset window, select the Analytics view and the Comparative Analyses tab. This tab shows all existing analyses for the site or asset.
2. Click New. The New Comparative Analysis dialog appears.
4.
5. In the Time period to analyze area, complete the following:
• Moving period: Select this option to set a time period that is relative to the current date. For example, if you are setting a time period for a comparative analysis, you could create an analysis for readings collected in the last month. If you select this option, each time you open the analysis or dashboard, you might see a different set of readings depending on the current date and the period that was selected to analyze.
• Fixed period: Select this option for a set time period. When you select this option, you can define the start and end date and time.
•
• Regular: the readings displayed are filtered based on the standard calendar. For example, if the dashboard is showing readings for the current month and the date is December 10, the dashboard shows readings for the period of December 1-10.
• Financial: the readings displayed are filtered based on your organization’s financial periods. For example, assume that your financial periods start on the first Tuesday of the month. For December 2002, the financial month would then start on December 3, 2002. In this case, on December 10, 2002 a dashboard that is showing “current month” based on the financial calendar would show readings for the period of December 3-10.
6.
7. Select the indicators for the analysis and click OK. They are listed on the Indicators to Compare tab. They are also added to the Degradation Indicators tab when you add them in the New Comparative Analysis dialog.
8. Select the Options tab, for example:
Select this option to show the Analysis view, Analysis tab. This tab displays readings over the specified time period.
Select this option to show current indicator values in the Analysis view, Indicators tab, Current tab.
To replace the default chart style shown in the Analysis view, Indicators tab, Current tab when the Chart icon is selected, choose a chart type from the list.
By default, a gauge sidebar is displayed in the Analysis view, Indicators tab, Readings tab. You can turn this feature off by clearing the selection.
By default, the target line is displayed in the Analysis view, Analysis tab. You can turn this feature off by clearing the selection.
10. Select the Degradation Indicators tab. This tab lists the indicators whose readings appear in the Analysis view and tab. When you add indicators using the New Comparative Analysis dialog, they are automatically added to this tab in the same order. For example:You can remove indicators or change their order. To include additional indicators, first add them on the Indicators to Compare tab.
11. Select the Activities tab.
Note: In degradation analysis, activities are shown in the Analysis view, Asset Activities tab only.
13. To create the analysis, click OK. The Comparative Analysis window appears. Settings can be adjusted using the tabs on the Properties view, General tab. For example:
14. Select the Analysis view, Degradation Analysis tab to see charts of the comparative analysis. This tab includes the Readings, Degradation Rates, Remaining Allowance, and Degradation Dashboards tabs. For example:
15. Select the Indicators tab to view current values (Current values on the Properties view, Options tab must be selected), and readings for the analysis.
16. Select the Asset Activities tab to view tables of the asset’s activities. You can choose from these table configurations:
17. Select the Notes tab to record information about the analysis.