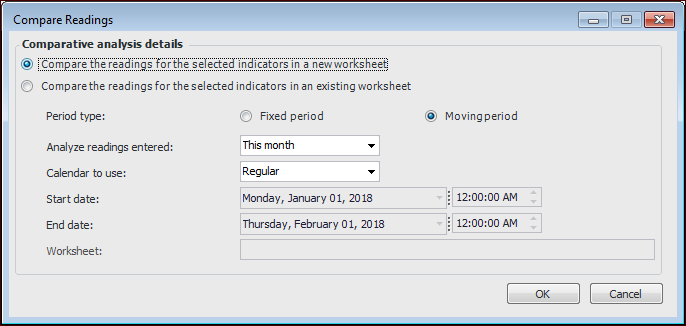
Creating an Ad Hoc Comparative Analysis from Indicators

You can create a comparative analysis by selecting two or more indicators in any view that lists indicators, for example, from an asset’s Inspection Management view. You can compare the readings of two or more numeric, calculated, cumulative, or performance indicators.
For information about comparing descriptive indicators, see Creating a Basic Comparative Analysis.
This topic describes how to create an ad hoc comparative analysis.

To Create an Ad Hoc Comparative Analysis

1.
Select any view that lists indicators, for example, an asset’s Inspection Management view, Indicators tab, Listing tab.
2.
3.
Right-click the selected indicators and click Compare Readings. The Compare Readings dialog appears. For example:
You can either create a comparative analysis or add the indicators to an existing analysis.
4.
To add the indicators to an existing worksheet, select Compare the readings for the selected indicators in an existing worksheet.
In the Compare Readings dialog, click OK. The Comparative Analysis window opens with the indicators added to it.
5.
To create an analysis, select Compare the readings for the selected indicators in a new worksheet and fill in the following:
Moving period: Select this option to set a time period that is relative to the current date. For example, if you are setting a time period for a comparative analysis, you could create an analysis for readings collected in the last month. If you select this option, each time you open the analysis or dashboard, you might see a different set of readings depending on the current date and the period that was selected to analyze.
Fixed period: Select this option for a set time period. When you select this option, you can define the start and end date and time.
Regular: the readings displayed are filtered based on the standard calendar. For example, if the dashboard is showing readings for the current month and the date is December 10, the dashboard shows readings for the period of December 1-10.
Financial: the readings displayed are filtered based on your organization’s financial periods. For example, assume that your financial periods start on the first Tuesday of the month. For December 2002, the financial month would then start on December 3, 2002. In this case, on December 10, 2002 a dashboard that is showing “current month” based on the financial calendar would show readings for the period of December 3-10.
Click OK. The system creates a new analysis with the selected indicators and opens the Comparative Analysis window, showing the Analysis view.
If you intend to save the analysis, select the Properties view, General tab. Provide a title for the analysis.
If you wish to show alarm state banding in line graphs, select the Options tab and select an indicator from the Indicator for bands list. This indicator’s states are shown in the chart.