|
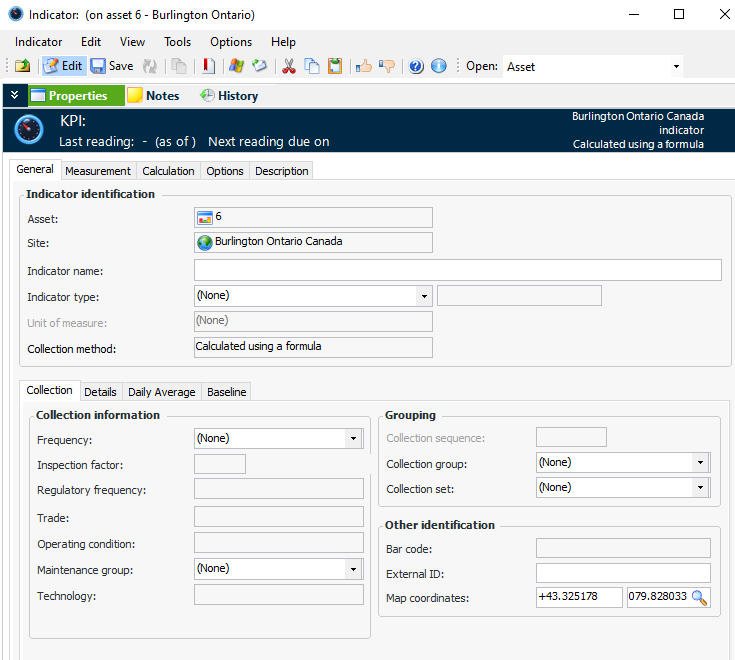
Creating a Performance Indicator from Scratch
If you wish to measure monetary values from sites that use different currencies, be sure to adjust your KPIs to perform the conversion to a base currency. For more information, see Introduction to Performance Indicators.To Create a Performance Indicator
1. From the site, select the Analytics view. The KPIs tab lists all of the performance indicators for the site. You can also view the table configuration for KPIs by Asset Performance Management Cycle element.
2. Click New. The Indicator window appears.
3. On the General tab, enter an indicator name. The name should describe what is being measured, such as “Percentage of Closed Work Orders.”
4. Select a performance indicator type from the Indicator type list. The tabs on the Properties view change according to the type you select.
5. The Unit of measure box shows the unit of measure (UOM) for the indicator type. In some cases, you can select a different UOM from the same category. For example, if the UOM of the indicator type is “hour”, you could change it to “day” or “week”.
6. On the Collection tab, select a collection frequency from Frequency list. This information is used for filtering indicator lists.
8. The value in the External ID box is copied from the indicator name. This short name for the indicator is optional, and does not have to be unique to the asset. You can change or remove the ID, if appropriate.
9. By default, the Map coordinates box is populated with the site’s coordinates if they have been recorded in its properties. You can change the longitude and latitude of the site’s location, or you can click the browse icon and point to the location on a map to have APM assign the coordinates. For more information, see Setting Map Coordinates.
10.
12. Select the Description tab to enter information about the KPI. You can also add an image by pasting it into the Image tab.
13. If the indicator type is numeric or cumulative, select the Measurement tab and the Limits tab, to set minimum and/or maximum values for readings used with gauges.
14. On the States and Alarms tab, you can set up states and alarms for the indicator. For detailed instructions, see Adding States and Alarms to an Indicator or Template.
15. Select the Calculation tab.
16. On the Expression tab, select the type of expression. A calculated indicator can be based on:
• VB.NET – Inputs and functions defined on the Calculation tab can be used to create a formula that is calculated at run time. This is the default option
• C# – Inputs and functions defined on the Calculation tab can be used to create a formula that is calculated at run time
• Stored procedure – The expression is provided in a stored procedure that receives its inputs at runtime and returns a valueWith the Complete class option, a starter script template is provided automatically, which you can edit as needed. You can also click Regenerate from Template to reset the formula to the starter script.Tip: You can view the template scripts by opening the Enterprise window, clicking the Administration menu and then Calculation options. For more information, see Defining Calculation Options.
• Calculation inputs (a variable that represents data from the system): enter a variable name for each indicator that you want to use in the calculation. Each calculation input must begin with a letter, cannot contain a period (.), must not exceed 20 characters, and must be unique within the calculation. For example, for a temperature indicator you might enter “Temperature1”.
• Operators (such as, add or multiply): type the operator in the format shown in Operators for Calculated Indicators.
• Constants (that is, a fixed value used in the calculation): enter the value of the constant in the calculation. For example to divide by two, you would enter “2”.
19. If the type of expression is stored procedure, the information on the Calculation tab changes:
21. To create each input, click the New list and click either Indicator Input or Filter Input. The Calculation Input dialog appears. Here is an example for an indicator input:
22. For VB.NET or C# script expressions, you can check the syntax (the order of the elements) of your calculation by clicking Check (Test). When you click this button, the system looks for errors in how you typed the calculation.
23. To use the test values on the inputs to complete a test calculation, click Calculate. You can use the result of this calculation to check that the expression is giving the desired results.
24. When you have defined the calculation expression and inputs, you can click Check (Live). The test function uses the values from the inputs (for example, indicator readings) and displays the result in the Test Reading window.
26. If necessary, you can change the Required Proximity of the calculation inputs.
27. Select the Frequency tab.
28. In the Triggering mechanism section, select when and how the system will trigger the calculation. If the calculation will be triggered at a regular interval (based on a recurrence pattern), define the scheduled interval for the indicator.
29. Select the Auditing tab. To improve product performance, you can control the amount of audit information generated when a reading is created. (The audit information is displayed in the Indicator Reading window, Calculation tab.)
• Full auditing – Full information is displayed on the reading’s Calculation tab
• Description and input values – The reading’s Calculation tab displays the description and input values in the text field. The table of input values is not displayed
• No auditing – The reading’s Calculation tab is not displayed
30.
Amount of time (for example, weeks, months, years) for which to show indicator readings. When this option is enabled, the Indicator window’s Readings view, Readings tab displays readings for this amount of time, ending with the next reading date. This setting also affects how KPI readings are displayed on dashboards.
32. If the performance indicator records information related to a stage in the Asset Performance Management cycle (for example, strategy development), select the Options tab and then the Reliability tab.
33. Select the appropriate element from the APM cycle element list and the sub-element from the Sub element list. These elements are used to set up dashboards showing the Asset Performance Management cycle and elements.Tip: To view performance indicators assigned to elements, select the site’s Analytics view and then the KPIs tab. From the list of configurations, select “KPIs by Asset Performance Management Cycle element”. The table contains “APM Element” and “APM Sub Element” columns, as well as indicator names, most recent values, and more.
34.