Creating Data Groups in Table Configurations

You can combine the data from several rows into one data group, enabling you to analyze data within the group. You can open each group to see what items it includes.
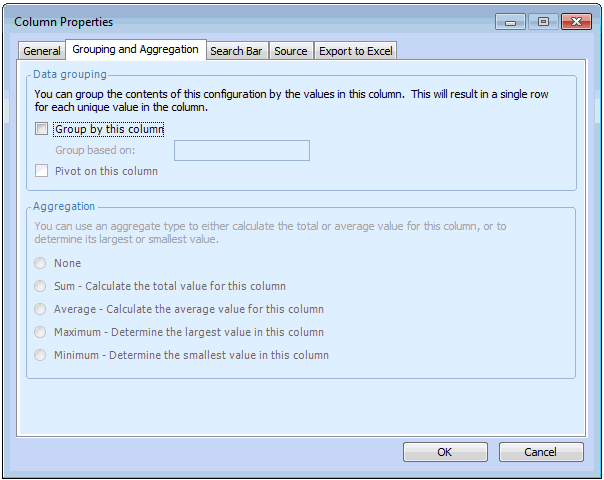
Create the data group from the column that has data you want to see combined. For example, to RCM analyses by status, you would create a data group from the Status column. To group analyses by facilitator, you would create a data group from the Facilitator column. To view work orders according to planned completion dates, create the data group on the Planned Completion Date column and specify the unit of measure (for example, day, hour, month, or year).
Here’s an example of a table in which work orders are grouped by asset name:
Here is an example in which assets are grouped by asset type:
 
You can include multiple data groups in one table configuration. For example, you could group analyses by facilitator and then by status. The order of the data groups is determined by the sequence of the columns. In this example, the Facilitator column must be to the left of the Status column. If the placement of the columns is reversed, the data would be grouped by status and then by facilitator.
Any column can be used to create a data group. However, if each row has different data, each data group includes only one item and no data could be summarized. Thus data groups are most useful if they are created from columns with a limited number of possible data points.

Aggregation

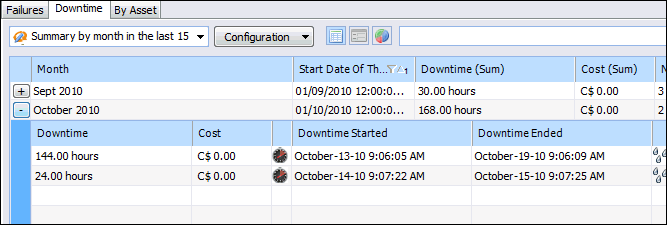
Once you have created a data group, you can include a summary of any numeric data available for the items in the group. For example, in a table configuration of downtime incidents, you might group the incidents by date. If you include the Downtime and Cost columns in the configuration, you could then include the totals for each in the group summary.
Note: If you are using the Average function on a group of items and one of those items has a NULL value, the NULL item will be ignored in the average calculation. For example, if you have four items and one has a NULL value, the average will be calculated by adding the other three values and dividing the total by three. Items with a value of zero will be included in the average calculation.
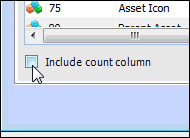
You can also add a Count column to a table configuration that includes grouped data. This column displays the number of items in each group. You can apply the usual sort and filter properties to a Count column.
This topic explains how to create data groups and aggregate numeric data.

To Create a Data Group

1.
2.
Click Configuration and then Open. The Configuration dialog appears, open to the Columns tab.
3.
4.
Select the Grouping and Aggregation tab.
5.
Select Group by this column.
6.
7.
Click OK to save the changes and close the Column Properties dialog.
8.
If you wish, select Include Count Column on the Configuration dialog. A count column displays the number of items included in a data group. You can only include a count column after you have created a data group.
9.
Click OK. Items in the table are now grouped according to the data in this column. If you selected Allow group rows to be expanded on the Appearance tab, Grid Settings tab, you can click the plus signs to expand the group.

To Aggregate Data for a Group

1.
2.
3.
Select the Grouping and Aggregation tab.
Note: The aggregate type options are available only if the column supports a numerical data type.
4.
None: No data aggregation is displayed for this column.
Sum: All of the values in the column are added together to produce a total value.
Average: All of the values in the column are added together and divided by the total number of rows to produce an average value.
Maximum: The highest value in the column is selected.
Minimum: The lowest value in the column is selected.
5.
6.
Click OK to close the Configuration dialog. The data groups display the aggregated data.